1 Formatting tabular data and creating a comma-delimited file
If the point locations for individual animals are already in a shapefile, you can skip to step 5. The following steps explain how to create a shapefile from point location coordinates stored as a tabular file such as in a spreadsheet.
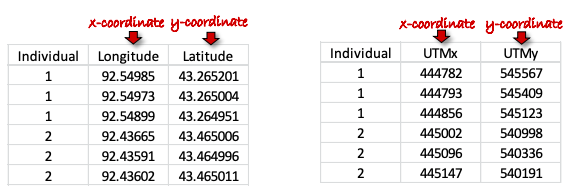
- Input point locations (coordinates) into Excel for all individuals. Data must be formatted with at least 2 columns: one column indicating the X coordinate (easting) and one column indicating the Y coordinate (northing). You MUST know the coordinate system in which the point locations were collected. For instance, in the table below (left), point locations were collected in a geographic coordinate system in units of decimal degrees. In the table below (right), point locations were collected in a projected coordinate system (Universal Transverse Mercator) in units of meters. You may also include an ID column indicating a unique identifier for individual animals.
MAKE SURE THAT ALL CELLS ARE FORMATTED AS NUBERS and NOT TEXT!! If there are cells formatted as text, they will not plot as points when you create a shapefile. To ensure that cells are formatted as numbers, select all cells, right-click and select format cells. Choose NUMBER. - Save the file as a text file with comma-separated values (i.e., CSV), and close Excel.
- Use ArcMap to create a shapefile from the CSV because a shapefile MUST be input into Geospatial Modeling Environment (GME).
- Open ArcMap.
- Add data → navigate to where the CSV is stored and add it into the ArcMap document.
- Open the attribute table (right-click on the file name in the Table of Contents to the left of the map document, select “Open Attribute Table”) to make sure the coordinates look correct.
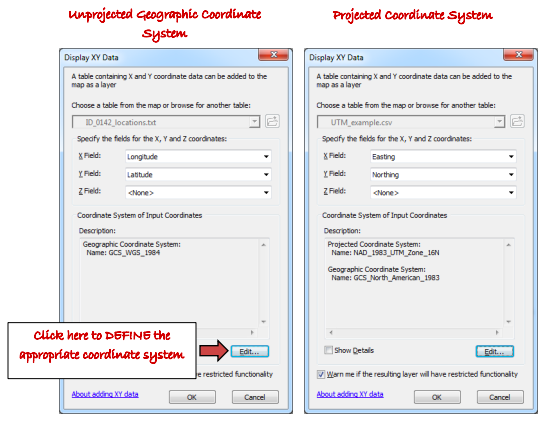
- In the Table of Contents, right-click the file name and select Display XY data.
- Specify the correct X and Y coordinates AND define the appropriate coordinate system. For instance, if the point locations were collected in lat-longs, then you would specify the correct coordinate system as a Geographic Coordinate System (e.g., GCS WGS 1984). If the point locations were collected in UTMs, then the correct coordinate system would be a Projected Coordinate System (e.g., UTM Zone 16 North; refer to figure below)
- Click OK in the “Display XY Data” dialog box. Then click OK again in the box indicating that the “Table Does Not Have an Object-ID Field.” This step creates an Event Theme (not a shapefile yet). An Event Theme displays the points, but it is not an actual shapefile. Thus, you will not be able to conduct any analyses until a shapefile is created.
- To create a shapefile, right-click on the name of the Event Theme in the Table of Contents. Navigate to Data → Export Data. Make sure you are specifying the format as a shapefile (and not a File Geodatabase unless you have created a geodatabase).VERY IMPORTANT: THE SHAPEFILE MUST BE PROJECTED! If your point locations were collected in lat-longs, and therefore your shapefile was defined in a geographic coordinate system, YOU MUST NOT LEAVE IT IN A GEOGRAPHIC COORDINATE SYSTEM! Home ranges CANNOT be created using GME for a shapefile that is unprojected.
- To reproject a shapefile in ArcMap, use the “Project” tool in Data Management Tools Projections and Transformations → Feature → Project. Select an appropriate projected coordinate system (e.g., UTM).