6 How to Analyze Data in a Primary Research Study
Melody Denny and Lindsay Clark
Overview
This chapter introduces students to the idea of working with primary research data grounded in qualitative inquiry, closed-and open-ended methods, and research ethics (Driscoll; Mackey and Gass; Morse; Scott and Garner).[1] We know this can seem intimidating to students, so we will walk them through the process of analyzing primary research, using information from public datasets including the Pew Research Center. Using sample data on teen social media use, we share our processes for analyzing sample data to demonstrate different approaches for analyzing primary research data (Charmaz; Creswell; Merriam and Tisdale; Saldaña). We also include links to additional public data sets, chapter discussion prompts, and sample activities for students to apply these strategies.
At this point in your education, you are familiar with what is known as secondary research or what many students think of as library research. Secondary research makes use of sources most often found in the library or, these days, online (books, journal articles, magazines, and many others). There’s another kind of research that you may or may not be familiar with: primary research. The Purdue OWL defines primary research as “any type of research you collect yourself” and lists examples as interviews, observations, and surveys (“What is Primary Research”).
Primary research is typically divided into two main types—quantitative and qualitative research. These two methods (or a mix of these) are used by many fields of study, so providing a singular definition for these is a bit tricky. Sheard explains that “quantitative research…deals with data that are numerical or that can be converted into numbers. The basic methods used to investigate numerical data are called ‘statistics’” (429). Guest, et al. explain that qualitative research is “information that is difficult to obtain through more quantitatively-oriented methods of data collection” and is used more “to answer the whys and hows of human behavior, opinion, and experience” (1).
This chapter focuses on qualitative methods that explore peoples’ behaviors, interpretations, and opinions. Rather than being only a reader and reporter of research, primary research allows you to be creators of research. Primary research provides opportunities to collect information based on your specific research questions and generate new knowledge from those questions to share with others. Generally, primary research tends to follow these steps:
- Develop a research question. Secondary research often uses this as a starting point as well. With primary research, however, rather than using library research to answer your research question, you’ll also collect data yourself to answer the question you developed. Data, in this case, is the information you collect yourself through methods such as interviews, surveys, and observations.
- Decide on a research method. According to Scott and Garner, “A research method is a recognized way of collecting or producing [primary data], such as a survey, interview, or content analysis of documents” (8). In other words, the method is how you obtain the data.
- Collect data. Merriam and Tisdale clarify what it means to collect data: “data collection is about asking, watching, and reviewing” (105-106). Primary research might include asking questions via surveys or interviews, watching or observing interactions or events, and examining documents or other texts.
- Analyze data. Once data is collected, it must then be analyzed. “Data analysis is the process of making sense out of the data… Basically, data analysis is the process used to answer your research question(s)” (Merriam and Tisdale 202). It’s worth noting that many researchers collect data and analyze at the same time, so while these may seem like different steps in the process, they actually overlap.
- Report findings. Once the researcher has spent time understanding and interpreting the data, they are then ready to write about their research, often called “findings.” You may also see this referred to as “results.”
While the entire research process is discussed, this chapter focuses on the analysis stage of the process (step 4). Depending on where you are in the research process, you may need to spend more time on step 1, 2, or 3 and review Driscoll’s “Introduction to Primary Research” (Volume 2 of Writing Spaces).
Primary research can seem daunting, and some students might think that they can’t do primary research, that this type of research is for professionals and scholars, but that’s simply not true. It’s true that primary research data can be difficult to collect and even more difficult to analyze, but the findings are typically very revealing. This chapter and the examples included break down this research process and demonstrate how general curiosity can lead to exciting chances to learn and share information that is relevant and interesting. The goal of this chapter is to provide you with some information about data analysis and walk you through some activities to prepare you for your own data analysis. The next section discusses analyzing data from closed-ended methods and open-ended methods.
Data from Primary Research
As stated above, this chapter doesn’t focus on methods, but before moving on to analysis, it’s important to clarify a few things related to methods as they are directly connected to analyzing data. As a quick reminder, a research method is how researchers collect their data such as surveys, interviews, or textual analysis. No matter which method used, researchers need to think about the types of questions to ask for answering their overall research question. Generally, there are two types of questions to consider: closed-ended and open-ended. The next section provides examples of the data you might receive from asking closed-ended and open-ended questions and options for analyzing and presenting that data.
Data from Closed-Ended Methods
The data that is generated by closed-ended questions on methods such as surveys and polls is often easier to organize. Because the way respondents could answer those questions is limited to specific answers (Yes/No, numbered scales, multiple choice), the data can be analyzed by each question or by looking at the responses individually or as a whole. Though there are several approaches to analyzing the data that comes from closed-ended questions, this section will introduce you to a few different ways to make sense of this kind of data.
Closed-ended questions are those that have limited answers, like multiple choice or check-all-that-apply questions. These questions mean that respondents can provide only the answers given or they may select an “other” option. An example of a closed-ended question could be “Do you use YouTube? Yes, No, Sometimes.” Closed-ended questions have their perks because they (mostly) keep participants from misinterpreting the question or providing unhelpful responses. They also make data analysis a bit easier.
If you were to ask the “Yes, No, Sometimes” question about YouTube to 20 of your closest friends, you may get responses like Yes = 18, No = 1, and Sometimes = 1. But, if you were to ask a more detailed question like “Which of the following social media platforms do you use?” and provide respondents with a check-all-that-apply option, like “Facebook, YouTube, Twitter, Instagram, Snapchat, Reddit, and Tumblr,” you would get a very different set of data. This data might look like Facebook = 17, YouTube = 18, Twitter = 12, Instagram = 20, Snapchat = 15, Reddit = 8, and Tumblr = 3. The big takeaway here is that how you ask the question determines the type of data you collect.
Analyzing Closed-Ended Data
Now that you have data, it’s time to think about analyzing and presenting that data. Luckily, the Pew Research Center conducted a similar study that can be used as an example. The Pew Research Center is a “nonpartisan fact tank that informs the public about the issues, attitudes and trends shaping the world. It conducts public opinion polling, demographic research, media content analysis and other empirical social science research” (“About Pew Research Center”). The information provided below comes from their public dataset “Teens, Social Media, and Technology, 2018” (Anderson and Jiang). This example is used to show how you might analyze this type of data once collected and what that data might look like. “Teens, Social Media, and Technology 2018” reported responses to questions related to which online platforms teens use and which they use most often. In figure 1 below, Pew researchers show the final product of their analysis of the data:
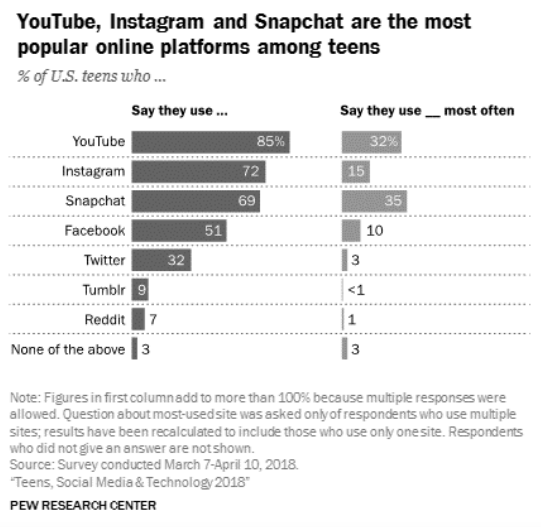
Technology 2018” dataset. Figure shows popularity of social media platforms from most to least popular: YouTube, Instagram, Snapchat, Facebook, Twitter,
Tumblr, Reddit. Used with permission from Pew Research Center.
Pew analyzed their data and organized the findings by percentages to show what they discovered. They had 743 teens who responded to these questions, so presenting their findings in percentages helps readers better “see” the data overall (rather than saying YouTube = 631 and Instagram = 535). However, results can be represented in different ways. When the Pew researchers were deciding how to present their data, they could have reported the frequency, or the number of people who said they used YouTube, Instagram, and Snapchat.
In the scenario of polling 20 of your closest friends, you, too, would need to decide how to present your data: Facebook = 17, YouTube = 18, Twitter = 12, Instagram = 20, Snapchat = 15, Reddit = 8, and Tumblr = 3. In your case, you might want to present the frequency (number) of responses rather than the percentages of responses like Pew did. You could choose a bar graph like Pew or maybe a simple table to show your data.
Looking again at the Pew data, researchers could use this data to generate further insights or questions about user preferences. For example, one could highlight the fact that 85% of respondents reported using YouTube the most, while only 7% reported using Reddit. Why is that? What conclusions might you be able to make based on these data? Does the data make you wonder if any additional questions might be explored? If you want to learn more about your respondents’ opinions or preference, you might need to ask open-ended questions.
Data from Open-Ended Methods
Whereas closed-ended questions limit how respondents might answer, open-ended questions do not limit respondents’ answers and allow them to answer more freely. An example of an open-ended question, to build off the question above, could be “Why do you use social media? Explain.” This type of question gives respondents more space to fully explain their responses. Open-ended questions can make the data varied because each respondent may answer differently. These questions, which can provide fruitful responses, can also mean unexpected responses or responses that don’t help to answer the overall research question, which can sometimes make data analysis challenging.
In that same Pew Research Center data, respondents were likely limited in how they were able to answer by selecting social media platforms from a list. Pew also shares selected data (Appendix A), and based on these data, it can be assumed they also asked open-ended questions, something about the positive or negative effects of social media platforms. Because their research method included both closed-ended questions about which platforms teens use as well as open-ended questions that invited their thoughts about social media, Pew researchers were able to learn more about these participants’ thoughts and perceptions. To give us, the readers, a clearer idea of how they justified their presentation of the data, Pew offers 15 sample excerpts from those open-ended questions. They explain that these excerpts are what the researchers believe are representative of the larger data set. We explain below how we might analyze those excerpts.
Analyzing Open-Ended Data
As Driscoll reminds us, ethical considerations impact all stages of the research process, and researchers should act ethically throughout the entire research process. You already know a little something about research ethics. For example, you know that ethical writers cite sources used in research papers by giving credit to the person who created that information. When creating primary sources, you have a few different ethical considerations for analyzing data, which will be discussed below.
To demonstrate how to analyze data from open-ended methods, we explain how we (Melody and Lindsay) analyzed the 15 excerpts from the Pew data using open coding. Open coding means analyzing the data without any predetermined categories or themes; researchers are just seeing what emerges or seems significant (Charmaz). Creswell suggests four specific steps when coding qualitative data, though he also stresses that these steps are iterative, meaning that researchers may need to revisit a step anywhere throughout the process. We use these four steps to explain our analysis process, including how we ethically coded the data, interpreted what the coding process revealed, and worked together to identify and explain categories we saw in the data.
Step 1: Organizing and Preparing the Data
The first part of the analysis stage is organizing the data before examining it. When organizing data, researchers must be careful to work with primary data ethically because that data often represents actual peoples’ information and opinions. Therefore, researchers need to carefully organize the data in such a way as to not identify their participants or reveal who they are. This is a key component to The Belmont Report, guidelines published in 1979 meant to guide researchers and help protect participants. Using pseudonyms or assigning numbers or codes (in place of names) to the data is a recommended ethical step to maintain participants’ confidentiality in a study. Anonymizing data, or removing names, has the additional effect of eliminating researcher bias, which can occur when researchers are so familiar with their own data and participants that the researchers may begin to think they already know the answers or see connections prior to analysis (Driscoll). By assigning pseudonyms, researchers can also ensure that they take an objective look at each participant’s answers without being persuaded by participant identity.
The first part of coding is to make notations while reading through the data (Merriam and Tisdale). At this point, researchers are open to many possibilities regarding their data. This is also where researchers begin to construct categories. Offering a simple example to illustrate this decision-making process, Merriam and Tisdale ask us to imagine sorting and categorizing two hundred grocery store items (204). Some items could be sorted into more than one category; for example, ice cream could be categorized as “frozen” or as “dessert.” How you decide to sort that item depends on your research question and what you want to learn.
For this step, we, Melody and Lindsay, each created a separate document that included the 15 excerpts. Melody created a table for the quotes, leaving a column for her coding notes, and Lindsay added spaces between the excerpts for her notes. For our practice analysis, we analyzed the data independently, and then shared what we did to compare, verify, and refine our analysis. This brings a second, objective view to the analysis, reduces the effect of researcher bias, and ensures that your analysis can be verified and supported by the data. To support your analysis, you need to demonstrate how you developed the opinions and conclusions you have about your data. After all, when researchers share their analyses, readers often won’t see all of the raw data, so they need to be able to trust the analysis process.
Step 2: Reading through All the Data
Creswell suggests getting a general sense of the data to understand its overall meaning. As you start reading through your data, you might begin to recognize trends, patterns, or recurring features that give you ideas about how to both analyze and later present the data. When we read through the interview excerpts of these 15 participants’ opinions of social media, we both realized that there were two major types of comments: positive and negative. This might be similar to categorizing the items in the grocery store (mentioned above) into fresh/frozen foods and non-perishable items.
To better organize the data for further analysis, Melody marked each positive comment with a plus sign and each negative comment with a minus sign. Lindsay color-coded the comments (red for negative, indicated by boldface type below; green for positive, indicated by grey type below) and then organized them on the page by type. This approach is in line with Merriam and Tisdale’s explanation of coding: “assigning some sort of shorthand designation to various aspects of your data so that you can easily retrieve specific pieces of the data. The designations can be single words, letters, numbers, phrases, colors, or combinations of these” (199). While we took different approaches, as shown the two sections below, both allowed us to visually recognize the major sections of the data:
Lindsay’s Coding Round 1, which shows her color coding indicated by boldface type
“[Social media] allows us to communicate freely and see what everyone else is doing. [It] gives us a voice that can reach many people.” (Boy, age 15)
“It makes it harder for people to socialize in real life, because they become accustomed to not interacting with people in person.” (Girl, age 15)
“[Teens] would rather go scrolling on their phones instead of doing their homework, and it’s so easy to do so. It’s just a huge distraction.” (Boy, age 17)
“It enables people to connect with friends easily and be able to make new friends as well.” (Boy, age 15)
“I think social media have a positive effect because it lets you talk to family members far away.” (Girl, age 14)
“Because teens are killing people all because of the things they see on social media or because of the things that happened on social media.” (Girl, age 14)
“We can connect easier with people from different places and we are more likely to ask for help through social media which can save people.” (Girl, age 15)
Melody’s Coding Round 1, showing her use of plus and minus signs to classify the comments as positive or negative, respectively
+ “[Social media] allows us to communicate freely and see what everyone else is doing. [It] gives us a voice that can reach many people.” (Boy, age 15)
– “It makes it harder for people to socialize in real life, because they become accustomed to not interacting with people in person.” (Girl, age 15)
– “[Teens] would rather go scrolling on their phones instead of doing their homework, and it’s so easy to do so. It’s just a huge distraction.” (Boy, age 17)
+ “It enables people to connect with friends easily and be able to make new friends as well.” (Boy, age 15)
+ “I think social media have a positive effect because it lets you talk to family members far away.” (Girl, age 14)
– “Because teens are killing people all because of the things they see on social media or because of the things that happened on social media.” (Girl, age 14)
+ “We can connect easier with people from different places and we are more likely to ask for help through social media which can save people.” (Girl, age 15)
Step 3: Doing Detailed Coding Analysis of the Data
It’s important to mention that Creswell dedicates pages of description on coding data because there are various ways of approaching detailed analysis. To code our data, we added a descriptive word or phrase that “symbolically assigns a summative, salient, essence-capturing, and/or evocative attribute” to a portion of data (Saldaña 3). From the grocery store example above, that could mean looking at the category of frozen foods and dividing them into entrees, side dishes, desserts, appetizers, etc. We both coded for topics or what the teens were generally talking about in their responses. For example, one excerpt reads “Social media allows us to communicate freely and see what everyone else is doing. It gives us a voice that can reach many people.” To code that piece of data, researchers might assign words like communication, voice, or connection to explain what the data is describing.
In this way, we created the codes from what the data said, describing what we read in those excerpts. Notice in the section below that, even though we coded independently, we described these pieces of data in similar ways using bolded keywords:
Melody’s Coding Round 2, with key words added to summarize the meanings of the different quotes
– “Gives people a bigger audience to speak and teach hate and belittle each other.” (Boy, age 13) bullying
– “It provides a fake image of someone’s life. It sometimes makes me feel that their life is perfect when it is not.” (Girl, age 15) fake
+ “Because a lot of things created or made can spread joy.” (Boy, age 17) reaching people
+ “I feel that social media can make people my age feel less lonely or alone. It creates a space where you can interact with people.” (Girl, age 15) connection
+ “[Social media] allows us to communicate freely and see what everyone else is doing. [It] gives us a voice that can reach many people.” (Boy, age 15) reaching people
Lindsay’s Coding Round 2, with key words added in capital letters to summarize the meanings of the quotations
“Gives people a bigger audience to speak and teach hate and belittle each other.” (Boy, age 13) OPPORTUNITIES TO COMMUNICATE NEGATIVELY/MORE EASILY
“It provides a fake image of someone’s life. It sometimes makes me feel that their life is perfect when it is not.” (Girl, age 15) FAKE, NOT REALITY
“Because a lot of things created or made can spread joy.” (Boy, age 17) SPREAD JOY
“I feel that social media can make people my age feel less lonely or alone. It creates a space where you can interact with people.” (Girl, age 15) INTERACTION, LESS LONELY
“[Social media] allows us to communicate freely and see what everyone else is doing. [It] gives us a voice that can reach many people.” (Boy, age 15) COMMUNICATE, VOICE
Though there are methods that allow for researchers to use predetermined codes (like from previous studies), “the traditional approach…is to allow the codes to emerge during the data analysis” (Creswell 187).
Step 4: Using the Codes to Create a Description Using Categories, Themes, Settings, or People
Our individual coding happened in phases, as we developed keywords and descriptions that could then be defined and relabeled into concise coding categories (Saldaña 11). We shared our work from Steps 1-3 to further define categories and determine which themes were most prominent in the data. A few times, we interpreted something differently and had to discuss and come to an agreement about which category was best.
In our process, one excerpt comment was interpreted as negative by one of us and positive by the other. Together we discussed and confirmed which comments were positive or negative and identified themes that seemed to appear more than once, such as positive feelings towards the interactional element of social media use and the negative impact of social media use on social skills. When two coders compare their results, this allows for qualitative validity, which means “the researcher checks for the accuracy of the findings” (Creswell 190). This could also be referred to as intercoder reliability (Lavrakas). For intercoder reliability, researchers sometimes calculate how often they agree in a percentage. Like many other aspects of primary research, there is no consensus on how best to establish or calculate intercoder reliability, but generally speaking, it’s a good idea to have someone else check your work and ensure you are ethically analyzing and reporting your data.
Interpreting Coded Data
Once we agreed on the common categories and themes in this dataset, we worked together on the final analysis phase of interpreting the data, asking “what does it mean?” Data interpretation includes “trying to give sense to the data by creatively producing insights about it” (Gibson and Brown 6). Though we acknowledge that this sample of only 15 excerpts is small, and it might be difficult to make claims about teens and social media from just this data, we can share a few insights we had as part of this practice activity.
Overall, we could report the frequency counts and percentages that came from our analysis. For example, we counted 8 positive comments and 7 negative comments about social media. Presented differently, those 8 positive comments represent 53% of the responses, so slightly over half. If we focus on just the positive comments, we are able to identify two common themes among those 8 responses: Interaction and Expression. People who felt positively about social media use identified the ability to connect with people and voice their feelings and opinions as the main reasons. When analyzing only the 7 negative responses, we identified themes of Bullying and Social Skills as recurring reasons people are critical of social media use among teens. Identifying these topics and themes in the data allows us to begin thinking about what we can learn and share with others about this data.
How we represent what we have learned from our data can demonstrate our ethical approach to data analysis. In short, we only want to make claims we can support, and we want to make those claims ethically, being careful to not exaggerate or be misleading.
To better understand a few common ethical dilemmas regarding the presentation of data, think about this example: A few years ago, Lindsay taught a class that had only four students. On her course evaluations, those four students rated the class experience as “Excellent.” If she reports that 100% of her students answered “Excellent,” is she being truthful? Yes. Do you see any potential ethical considerations here? If she said that 4/4 gave that rating, does that change how her data might be perceived by others? While Lindsay could show the raw data to support her claims, important contextual information could be missing if she just says 100%. Perhaps others would assume this was a regular class of 20-30 students, which would make that claim seem more meaningful and impressive than it might be.
Another word for this is cherry picking. Cherry picking refers to making conclusions based on thin (or not enough) data or focusing on data that’s not necessarily representative of the larger dataset (Morse). For example, if Lindsay reported the comment that one of her students made about this being the “best class ever,” she would be telling the truth but really only focusing on the reported opinion of 25% of the class (1 out of 4). Ideally, researchers want to make claims about the data based on ideas that are prominent, trending, or repeated. Less prominent pieces of data, like the opinion of that one student, are known as outliers, or data that seem to “be atypical of the rest of the dataset” (Mackey and Gass 257). Focusing on those less-representative portions might misrepresent or overshadow the aspects of the data that are prominent or meaningful, which could create ethical problems for your study. With these ethical considerations in mind, the last step of conducting primary research would be to write about the analysis and interpretation to share your process with others.
Conclusion
This chapter has introduced you to ethically analyzing data within the primary research tradition by focusing on close-ended and open-ended data. We’ve provided you with examples of how data might be analyzed, interpreted, and presented to help you understand the process of making sense of your data. This is just one way to approach data analysis, but no matter your research method, having a systematic approach is recommended. Data analysis is a key component in the overall primary research process, and we hope that you are now excited and curious to participate in a primary research project.
Works Cited
“About Pew Research Center.” Pew Research Center, 2020. www.pewresearch.org/about/. Accessed 28 Dec 2020. Anderson, Monica, and Jingjing Jiang.
“Teens, Social Media & Technology 2018.” Pew Research Center, May 2018, www.pewresearch.org/internet/2018/05/31/teens-social-media-technology-2018/.
The Belmont Report: Ethical Principles and Guidelines for the Protection of Human Subjects of Research, Office for Human Research Protections, www.hhs.gov/ohrp/regulations-and-policy/belmont-report/read-the-belmont-report/index.html. 18 Apr. 1979.
Charmaz, Kathy. “Grounded Theory.” Approaches to Qualitative Research: A Reader on Theory and Practice, edited by Sharlene Nagy Hesse-Biber and Patricia Leavy, Oxford UP, 2004, pp. 496-521.
Corpus of Contemporary American English (COCA). (n.d.). Retrieved April 11, 2021, from https://www.english-corpora.org/coca/
Creswell, John W. Research Design: Qualitative, Quantitative, and Mixed Methods Approaches, 3rd edition, Sage, 2009.
Data.gov. (2020). Retrieved April 11, 2021, from https://www.data.gov/
Driscoll, Dana Lynn. “Introduction to Primary Research: Observations, Surveys, and Interviews.” Writing Spaces: Readings on Writing, Volume 2, Parlor Press, 2011, pp. 153-174.
Explore Census Data. (n.d.). United States Census Bureau. Retrieved April 11, 2021, from https://data.census.gov/cedsci/
Gibson, William J., and Andrew Brown. Working with Qualitative Data. London, Sage, 2009.
Google Trends. (n.d.). Retrieved April 11, 2021, from https://trends.google.com/trends/explore
Guest, Greg, et al. Collecting Qualitative Data: A Field Manual for Applied Research. Sage, 2013.
HealthData.gov. (n.d.). Retrieved April 11, 2021, from https://healthdata.gov/
Lavrakas, Paul J. Encyclopedia of Survey Research Methods. Sage, 2008.
Mackey, Allison, and Sue M. Gass. Second Language Research: Methodology and Design. Lawrence Erlbaum Associates, 2005.
Merriam, Sharan B., and Elizabeth J. Tisdell. Qualitative Research: A Guide to Design and Implementation, John Wiley & Sons, Incorporated, 2015. ProQuest Ebook Central, https://ebookcentral.proquest.com/lib/unco/detail.action?docID=2089475.
Michigan Corpus of Academic Spoken English. (n.d.). Retrieved April 11, 2021, from https://quod.lib.umich.edu/cgi/c/corpus/corpus?c=micase;page=simple
Morse, Janice. M. “‘Cherry Picking’: Writing from Thin Data.” Qualitative Health Research, vol. 20, no. 1, 2009, p. 3.
Pew Research Center. (2021). Retrieved April 11, 2021, from https://www.pewresearch.org/
Saldaña, Johnny. The Coding Manual for Qualitative Researchers, 2nd edition, Sage, 2013.
Scott, Greg, and Roberta Garner. Doing Qualitative Research: Designs, Methods, and Techniques, 1st edition, Pearson, 2012.
Sheard, Judithe. “Quantitative Data Analysis.” Research Methods Information, Systems, and Contexts, edited by Kirsty Williamson and Graeme Johanson, Elsevier, 2018, pp. 429-452.
Teens and Social Media, Google Trends, trends.google.com/trends/explore?-date=all&q=teens%20and%20social%20media. Accessed 15 Jul. 2020.
“What is Primary Research and How Do I Get Started?” The Writing Lab and OWL at Purdue and Purdue U, 2020. owl.purdue.edu/owl. Accessed 21 Dec. 2020.
Zhao, Alice. “How Text Messages Change from Dating to Marriage.” Huffington Post, 21 Oct. 2014, www.huffpost.com.
Appendix A
“My mom had to get a ride to the library to get what I have in my hand all the time. She reminds me of that a lot.” (Girl, age 14)
“Gives people a bigger audience to speak and teach hate and belittle each other.” (Boy, age 13)
“It provides a fake image of someone’s life. It sometimes makes me feel that their life is perfect when it is not.” (Girl, age 15)
“Because a lot of things created or made can spread joy.” (Boy, age 17)
“I feel that social media can make people my age feel less lonely or alone. It creates a space where you can interact with people.” (Girl, age 15)
“[Social media] allows us to communicate freely and see what everyone else is doing. [It] gives us a voice that can reach many people.” (Boy, age 15)
“It makes it harder for people to socialize in real life, because they become accustomed to not interacting with people in person.” (Girl, age 15)
“[Teens] would rather go scrolling on their phones instead of doing their homework, and it’s so easy to do so. It’s just a huge distraction.” (Boy, age 17)
“It enables people to connect with friends easily and be able to make new friends as well.” (Boy, age 15)
“I think social media have a positive effect because it lets you talk to family members far away.” (Girl, age 14)
“Because teens are killing people all because of the things they see on social media or because of the things that happened on social media.” (Girl, age 14)
“We can connect easier with people from different places and we are more likely to ask for help through social media which can save people.” (Girl, age 15)
“It has given many kids my age an outlet to express their opinions and emotions, and connect with people who feel the same way.” (Girl, age 15)
“People can say whatever they want with anonymity and I think that has a negative impact.” (Boy, age 15)
“It has a negative impact on social (in-person) interactions.” (Boy, age 17)
Teacher Resources for How to Analyze Data in a Primary Research Study
Overview and Teaching Strategies
This chapter is intended as an overview of analyzing qualitative research data and was written as a follow-up piece to Dana Lynn Driscoll’s “Introduction to Primary Research: Observations, Surveys, and Interviews” in Volume 2 of this collection. This chapter could work well for leading students through their own data analysis of a primary research project or for introducing students to the idea of primary research by using outside data sources, those in the chapter and provided in the activities below, or data you have access to.
From our experiences, students usually have limited experience with primary research methods outside of conducting a small survey for other courses, like sociology. We have found that few of our students have been formally introduced to primary research and analysis. Therefore, this chapter strives to briefly introduce students to primary research while focusing on analysis. We’ve presented analysis by categorizing data as open-ended and closed-ended without getting into too many details about qualitative versus quantitative. Our students tend to produce data collection tools with a mix of these types of questions, so we feel it’s important to cover the analysis of both.
In this chapter, we bring students real examples of primary data and lead them through analysis by showing examples. Any of these exercises and the activities below may be easily supplemented with additional outside data. One way that teachers can bring in outside data is through the use of public datasets.
Public Data Sets
There are many public data sets that teachers can use to acquaint their students with analyzing data. Be aware that some of these datasets are for experienced researchers and provide the data in CSV files or include metadata, all of which is probably too advanced for most of our students. But if you are comfortable converting this data, it could be valuable for a data analysis activity.
- In the chapter, we pulled from Pew Research, and their website contains many free and downloadable data sets (Pew Research Center).
- The site Data.gov provides searchable datasets, but you can also explore their data by clicking on “data” and seeing what kinds of reports they offer.
- The U.S. Census Bureau offers some datasets as well (Explore Census Data): Much of this data is presented in reports, but teachers could pull information from reports and have students analyze the data and compare their results to those in the report, much like we did with the Pew Research data in the chapter.
- Similarly, HealthData.gov offers research-based reports packed with data for students to analyze.
- In one of the activities below, we used Google Trends to look at searches over a period of time. There are some interesting data and visuals provided on the homepage to help students get started.
- If you’re looking for something a bit more academic, the Michigan Corpus of Academic Spoken English is a great database of transcripts from academic interactions and situations.
- Similarly, the Corpus of Contemporary American English allows users to search for words or word strings to see their frequency and in which genre and when these occur.
Before moving on to student activities, we’d like to offer one additional suggestion for teachers to consider.
Class Google Form
One thing that Melody does at the beginning of almost all of her research-based writing courses is ask students to complete a Google Form at the beginning of the semester. Sometimes, these forms are about their experiences with research. Other times, they revolve around a class topic (recently, she’s been interested in Generation Z or iGeneration and has asked students questions related to that). Then, when it’s time to start thinking about primary research, she uses that Google Form to help students understand more about the primary research process. Here are some ways that teachers can employ the data gathered from Google Form given to students.
- Ask students to look at the questions asked on the survey and deduce the overall research question.
- • Ask students to look at the types of questions asked (open- and closed-ended) and consider why they were constructed that way.
- Ask students to evaluate the wording of the questions asked.
- Ask students to examine the results of a few (or more) or the questions on the survey. This can be done in groups with each group looking at 1-3 questions, depending on the size of your Google Form.
- Ask students to think about how they might present that data in visual form. Yes, Google provides some visuals, but you can give them the raw data and see what they come up with.
- Ask students to come up with 1-3 major takeaways based on all the data.
This exercise allows students to work with real data and data that’s directly related to them and their classmates. It’s also completely within ethical boundaries because it’s data collected in the classroom, for educational purposes, and it stays within the classroom.
Below we offer some guiding questions to help move students through the chapter and the activities as well as some additional activities.
Discussion Questions
- In the opening of this chapter, we introduced you to primary research, or “any type of research you collect yourself” (“What is Primary Research”). Have you completed primary research before? How did you decide on your research method, based on your research question? If you have not worked on primary research before, brainstorm a potential research question for a topic you want to know more about. Discuss what research method you might use, including closed- or open-ended methods and why.
- Looking at the chart from the Pew Research dataset, “Teens, Social Media, and Technology 2018,” would you agree that the distributions among online platforms remain similar, or have trends changed?
- What do you make of the “none of the above” category on the Pew table? Do you think teens are using online platforms that aren’t listed, or do you think those respondents don’t use any online platforms?
- Google Trends (figure 2 below) also allows researchers to look at web search data over time, by continent and related inquiries. On this site, we searched “teens and social media” and found another piece of data that shows interest over time. What does this graphic tell you? What other questions arise while looking at this data?
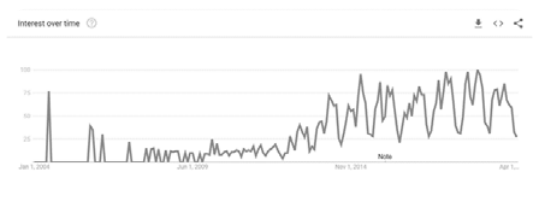
Figure 2. Google Trends for “Teens and Social Media.” A line graph from Google Trends, showing how teen social media use has increased over time. Screenshot by authors. - When analyzing data from open-ended questions, which step seems most challenging to you? Explain.
Activities
Activity #1: TurnItIn and Infographics
Infographics can be a great way to help you see and understand data, while also giving you a way to think about presenting your own data. Multiple infographics are available on TurnItIn, downloadable for free, that provide information about plagiarism.
Figure 3, titled “The Plagiarism Spectrum,” provides you with the “severity” and “frequency” based on survey findings of nearly 900 high school and college instructors from around the world. TurnItIn encourages educators to print this infographic and hang in their classroom:
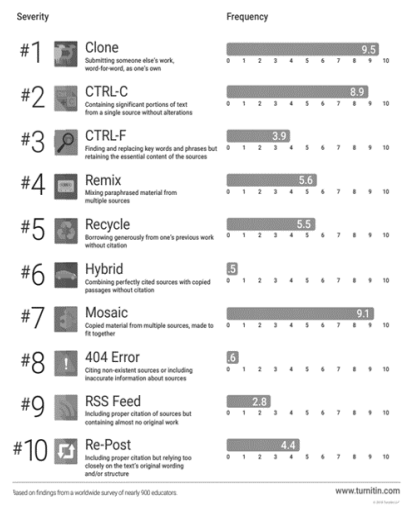
This infographic provides some great data analysis examples: specific categories with definitions (and visual representation of their categories), frequency counts with bar graphs, and color gradient bars to show higher vs. lower numbers.
- Write a summary of how this infographic presents data.
- How do you think they analyzed the data based on this visual?
Activity #2: How Text Messages Change from Dating to Marriage
In Alice Zhao’s Huffington Post piece, she analyzes text messages that she collected during her relationship with her boyfriend, turned fiancé, turned husband to answer the question of how text messages (or communication) change over the course of a relationship. While Zhao offers some insight into her data, she also provides readers with some really cool graphics that you can use to practice your analysis skills.
These first graphics are word clouds. In figure 4, Zhao put her textual data into a program that creates these images based on the most frequently occurring words. Word clouds are another option for analyzing your data. If you have a lot of textual data and want to know what participants said the most, placing your data into a word cloud program is an easy way to “see” the data in a new way. This is usually one of the first steps of analysis, and additional analysis is almost always needed.
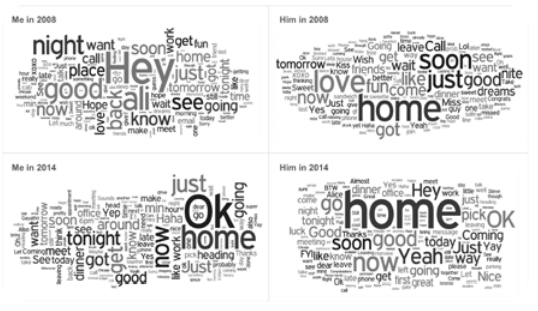
text messages with her boyfriend; the larger the word, the more frequently that
word appeared in the text. “Hey,” “home,” and “Ok” appear as frequently used
words. Used with permission.
- What do you notice about the texts from 2008 to 2014?
- What do you notice between her texts (me) and his texts (him)?
Zhao also provided this graphic (figure 5), a comparative look at what she saw as the most frequently occurring words from the word clouds. This could be another step in your data analysis procedure: zooming in on a few key aspects and digging a bit deeper.
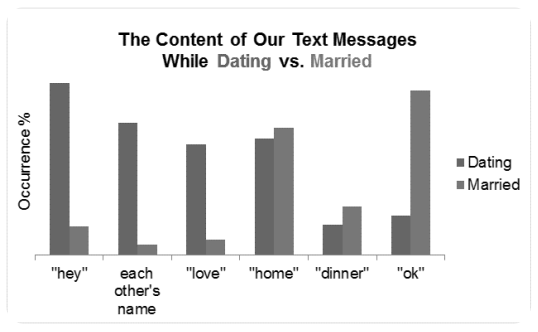
from her word clouds to show the most frequently occurring words they used
when dating versus when married. Used with permission.
- What do you make of this data? Why might the word “hey” occur more frequently in the dating time frame and the word “ok” occur more frequently in the married time frame?
As part of her research, Zhao also looked at the time of day text messages were sent, shown below in figure 6:
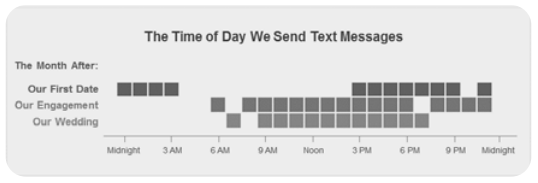
what time of day they texted most frequently, over the time period from dating to
marriage. Used with permission.
Here, Zhao looked at messages sent a month after their first date, a month after their engagement, and a month after their wedding.
- She offers her own interpretation in her piece in figure 6, but what do you think of this?
- Also make note of this graphic. It’s a great way to look at the data another way. If your data may be time sensitive, this type of graphic may help you better analyze and understand your data.
- This work is licensed under the Creative Commons Attribution-NonCommercial-NoDerivatives 4.0 International License (CC BY-NC-ND 4.0) and is subject to the Writing Spaces Terms of Use. To view a copy of this license, visit http://creativecommons.org/licenses/by-nc-nd/4.0/, email info@creativecommons.org, or send a letter to Creative Commons, PO Box 1866, Mountain View, CA 94042, USA. To view the Writing Spaces Terms of Use, visit http://writingspaces.org/terms-of-use. ↵
