3 Sociological Research Methods
Learning Objectives
In this chapter you will:
- Compare and contrast social science research methods.
- Evaluate strengths and weaknesses in research design.
Research methods are the techniques and tools used to collect data and systematically study the social world (Conley 2019). Sociological research methods are typically grouped into two categories:
- Quantitative methods involve a large number of research participants and produce numeric data that are analyzed statistically to test hypotheses.
- Qualitative methods involve small samples of research participants and produce textual or visual data that are thematically analyzed to uncover deeper meanings.
Let’s look at some examples of each.
Quantitative Research Methods

First, survey research is a common example of quantitative methods used in social science research. Surveys contain fixed-answer questions that can be converted to a numeric value for statistical analysis (Bhattacherjee 2012). Some researchers use existing data from nationally representative surveys, like the American Community Survey conducted by the U.S. Census Bureau.
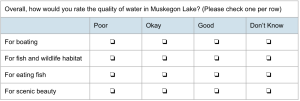
Other researchers create their own surveys to collect data on locally relevant issues. For example, in the Social Science Lab we recently asked residents in the City of Muskegon, Michigan about their impressions of the Muskegon Lake restoration, including current water quality in the lake.
One strength of quantitative methods is that research results can be generalized to a larger group of people beyond the study sample, giving us information about a broad cross-section of a population of interest. However, because quantitative data must be expressed in numbers, they can often tell us what people think or do but not why. To get at the “why” that underlies human beliefs and behaviors, we need qualitative research.
Qualitative Research Methods
There are a variety of qualitative methods that help uncover the meanings behind people’s actions.
In observation research, researchers spend time observing a group of people to learn about the cultural norms and motives that drive particular actions. They may participate in that culture, or they may observe without participating. One example is Matthew Desmond’s (2016) work, Evicted. In this book, Desmond describes his participant observation of individuals experiencing eviction to uncover barriers to housing security faced by low-income families.
In-depth interviewing, where researchers ask participants a series of questions intended to encourage lengthy discussion of the research topic, is also a commonly used qualitative research method. Interview research has been used to get at the heart of complex problems. In the example “Why Detroit Residents Pushed Back Against Tree-Planting,” (below) interview research helped city planners understand why Detroit residents rejected free tree plantings in their neighborhood (Mock 2019).
Content analysis of texts or written communication is used to identify patterns in how people talk about or make sense of pressing social issues. For example, check out the analysis linked below, which discusses what memes tell us about how people in work-from-home, professional occupations experienced the coronavirus pandemic.
Although this is hardly an exhaustive list of research methods, visual methods also deserve a mention. Visual methods consist of a variety of research methods that systematically analyze art, drawings, photography, videos, or maps created by a population of interest to the research questions. For example, follow the link below to listen to Jill Weinberg describe her use of post-it notes to generate data and dialogue.
Quality Control
When you are evaluating research reported in the news or on social media, it’s important to think critically about the research methodology used to collect the data being reported. This is particularly important when reading reports of quantitative studies, such as surveys, because numbers are powerful. As a result, the results of survey research and public opinion polling are commonly cited in popular press. As a general rule, the more outlandish the findings, the closer you ought to scrutinize the research methods. This may require some digging! Here are a few things to keep in mind.
Validity
The goal of quantitative research is often to test the relationship between two or more variables, which are characteristics – like an attitude, trait, or behavior – that have two or more potential values. For example, the variable “education level” has several categories: less than high school, high school graduate, some college, two-year technical degree, bachelor’s degree, or graduate degree. Assigning measurements to concepts relevant to a particular study is known as the process of operationalization. The way that a concept is operationalized has important bearings on the validity of the measure. Valid measures operationalize variables such that the variable measures what is intended to be measured.
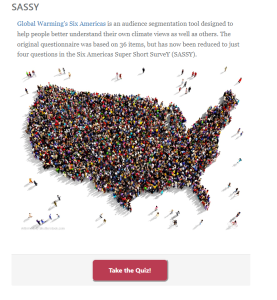
Bear with me. The Yale Program on Climate Change Communication is a group of social scientists studying public opinions and behaviors related to climate change. Their goal is to inform communication strategies used by public and private organizations engaging in climate education (YPCCC 2022). The program developed a four-question “SASSY” survey to classify people into one of six groups, from “alarmed” to “dismissive,” according to their level of concern about climate change. Use the link at right to access the survey and click through the questions (you don’t have to answer honestly, just screen the survey questions).
Each of the four SASSY survey questions is intended to operationalize the concept “concern about climate change,” which is tricky business because concern is a mushy concept. The second question in the survey, “How worried are you about global warming?” seems like a straightforward way of measuring climate concern. However, the third question, “Climate change is likely to harm me personally,” raises some concerns in its own right. Climate change is, of course, not projected to impact all geographies equally. According to the U.S EPA’s (2020) resilience screening index for natural hazards (pictured below), the Atlantic seaboard and southern U.S. states are forecasted to experience natural hazards in the coming years, but Michigan and much of the northern Midwest are looking pretty good! 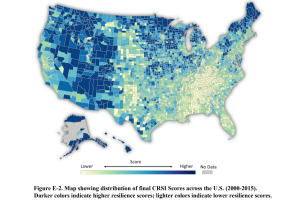
It therefore might be totally rational for a SASSY respondent from Duluth, Minnesota to say they expect climate change to harm them personally “not at all,” even as they hold a great deal of concern about how climate change will impact the ocean environment, or people living in remote corners of the Andes Mountains. How valid, then, is the third question as a measure of climate concern? Measuring complex concepts is difficult and information consumers should be on the look-out for measurements that poorly represent the concept they were intended to operationalize.
Reliability
Additionally, consider whether or not the research methods used are likely to be reliable, meaning that a systematic, replicable process was used to collect and analyze data. Reliability is particularly important in quantitative research, and difficult to achieve in qualitative research. That’s because the interviewer themselves – their ability to read non-verbal cues or be quick on their feet with follow-up questions – has a large influence on the quality and quantity of data collected from the interview participant. In contrast, the researcher may not interact very much at all with survey participants. In survey research, it is important that each potential participant receives the seem solicitation, the same instructions, the same questions, follows the same procedure to complete their questionnaire, and that all data are analyzed in the same way using a procedure that can be described to and repeated by anyone else.
Generalizability
Finally, carefully consider whether the research has been designed so that it is generalizable to the broader groups the study claims to represent. For example, most surveys include a sample of the population subset of interest to the researcher. In the example shown earlier of the Muskegon Lake residential survey, the research population we were interested in was all residents who live in the City of Muskegon, who are a specific subset of the larger population of Michigan residents. Rather than mailing a survey to all 30,000 residents in Muskegon, which would be very expensive, we obtained a list of all property owners in the city and used a random number generator in Excel to draw a random sample of 1,200 residents, who were mailed a copy of the survey. This is known as probability sampling, and is often simply called random sampling.
Hear it from the experts:
In order for survey researchers to make claims about the broader population from which the sample of people who completed the survey was drawn – otherwise known as generalizing their results –all members of a research population must have had an equal chance of being selected to complete the survey. So, if I stood outside of the Walmart in Norton Shores and asked the first 1,200 people I saw to complete the survey, that wouldn’t be a random sample because only people who shop at Walmart on the particular day and time I conducted my survey had a chance of being selected for participation.
Likewise, if I posted a link to the survey on social media sites of various community organizations – a REALLY POPULAR way of soliciting survey participants – the study results would only apply to people connected to those particular social media networks, who likely differ from the average Muskegon resident in some way. They may be more civically engaged, more interested in lake recreation, wealthier and more influential, or otherwise distinctive from the vast majority of Muskegon residents who are not following the social media accounts of the groups I’ve asked to share my survey link. In either case, my research results could not be accurately generalized to the broader population of Muskegon residents. This is a common flaw of research design that you should be on the lookout for as you interpret research reported in popular and news media.
Generalizability is typically not a goal in qualitative research, which usually relies on a variety of non-probability sampling techniques to solicit participants. However, the best qualitative research (IMHO) strategically recruits participants who represent diverse viewpoints on the topic of the study, to ensure that a broad range of perspectives and truths are included in their data. Reader beware of studies that represent dynamic issues through the eyes and voices of a single stakeholder group. It’s nearly always more complicated than that!
In Sum
Sociological research helps us understand why people believe or act in particular ways. This information is critical for developing programs, policies, and plans members of the public will support, creating solutions that effectively deal with societal problems, and analyzing where processes intended to meet public needs fall short or break down. Not all research is created equal, and it’s important to be able to identify faulty elements of research design – such as errors in validity, reliability, and generalizability – that compromise the conclusions drawn by the researcher. When done well, sociological research can reveal the complexity of social phenomena, highlighting divergent viewpoints on a given issue and developing a nuanced understanding of the social world.
References
Berg, Bruce L. 2007. Qualitative Research Methods for the Social Sciences, 6th edition. Boston, MA: Pearson.
Bhattacherjee, Anol. 2012. “Social Science Research: Principles, Methods, and Practices.” Textbook Collections. 3 (http://scholarcommons.usf.edu/oa_textbooks/3).
Conley, Dalton. 2019. You May Ask Yourself: An Introduction to Thinking Like a Sociologist, 6th edition. New York: W.W. Norton.
Desmond, Matthew. 2016. Evicted: Poverty and Profit in the American City. New York: Broadway Books.
Flaherty, Michael G. and Cosima Rughinis. 2021. “What Do Memes Tell Us about Self and Time During the Pandemic?” Contexts. Accessed 21 July, 2022. (https://contexts.org/articles/what-do-memes-tell-us-about-self-and-time-during-the-pandemic/).
Green, Kyle. 2017. “Jill Weinberg on Post-It Notes as a Visual Method. Give Methods a Chance. Accessed 21, July 2022. (https://thesocietypages.org/methods/2017/03/18/jill-weinberg-on-post-it-notes-as-a-visual-method/).
Mock, Brentin. 2019. “Why Detroit Residents Pushed Back Against Tree-Planting.” Bloomberg. Accessed 21, July 2022. (https://www.bloomberg.com/news/articles/2019-01-11/why-detroiters-didn-t-trust-city-tree-planting-efforts).
US EPA. 2020. “Development of a Cumulative Resilience Screening Index (CRSI) for Natural Hazards: An Assessment of Resilience to Acute Meteorological Events and Selected Natural Hazards.” Accessed 21 July, 2022. (https://cfpub.epa.gov/si/si_public_record_Report.cfm?dirEntryId=350154&Lab=CEMM).
“Why Social Science?” Consortium of Social Science Associations. Accessed 21 July, 2022 (https://www.whysocialscience.com/).
Yale Program on Climate Change Communication. 2022. “About the Program.” Accessed 21 July, 2022. (https://climatecommunication.yale.edu/about/the-program/).
Research techniques involving a large number of research participants and producing numeric data that are analyzed statistically to test hypotheses (Conley 2019).
Research techniques involving small samples of research participants and producing textual or visual data that are thematically analyzed to uncover deeper meanings (Conley 2019).
A quantitative research method using fixed-answer questions that can be converted to a numeric value for statistical analysis (Bhattacherjee 2012).
A qualitative research method involving prolonged observation of and interaction with a group of people (Berg 2007).
A qualitative research method in which a researcher asks participants a series of questions to inspire lengthy discussion and dialogue about the research topic (Berg 2007).
A qualitative research method involving identification of thematic patterns in written communication or texts (Berg 2007).
A qualitative research method in which research participants create visual artifacts (i.e., art, drawings, photography, videos, or maps) that are analyzed by the researcher (Green 2017).
Measurable characteristics that have two or more potential values (Conley 2019).
The process of assigning measurements to concepts (Conley 2019).
Degree to which variables accurately measure the concept they were intended to measure (Conley 2019).
The degree to which the process used to collect and analyze data can be replicated (Conley 2019).
The degree to which data from a research sample can be used to infer conclusions about the broader population from which the sample was drawn (Conley 2019).
