6 Putting Social Problems in their Place
Learning Objectives
In this chapter, you will:
- Examine data documenting economic, demographic, and technological changes over time.
- Explore variation in economic opportunity in U.S. neighborhoods.
My research on fractivism primed me to be receptive to Hans Rosling’s message about moderating our drama intake and getting in touch with the data when I first picked up Factfulness several years ago. In a qualitative data context, like my interviews and observations of the SoIL fracking debate, getting in touch with the data means making sure that every conceivable stakeholder viewpoint is represented, and being willing to “look a little harder at [all] sides” (Personal interview, O.IL – see Chapter 5). In a quantitative data context, getting in touch with the data means taking a broad, long-term perspective on where we’ve come, where we are, and where we may be headed.
To support public data literacy about a wide range of social, environmental, and economic issues, data scientists have developed several user-friendly tools that translate complex statistics into visualizations that are easy to read and interpret. In this chapter, I’ll focus on a mapping tool that I like for examining the socioeconomic status (SES) of U.S. neighborhoods.
The Great Enrichment
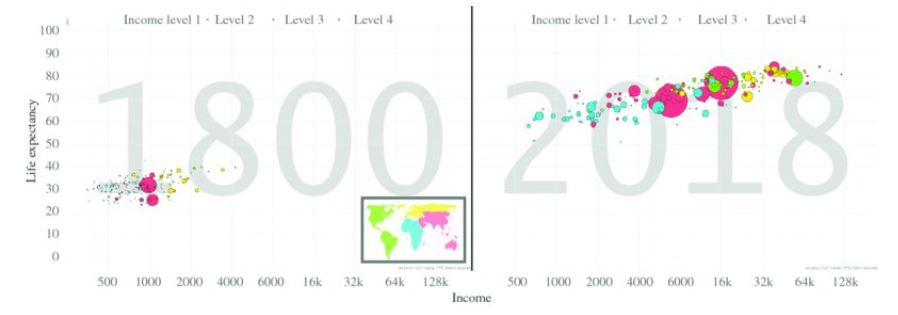
As we saw in Hans Rosling’s data visualizations (Figure 1), there has been steady growth in material wealth across the world – albeit slowly and unevenly, sometimes in fits and starts – and it is associated with a decrease in child mortality, an increase in adult longevity, and higher standards of living in every conceivable category of human experience.
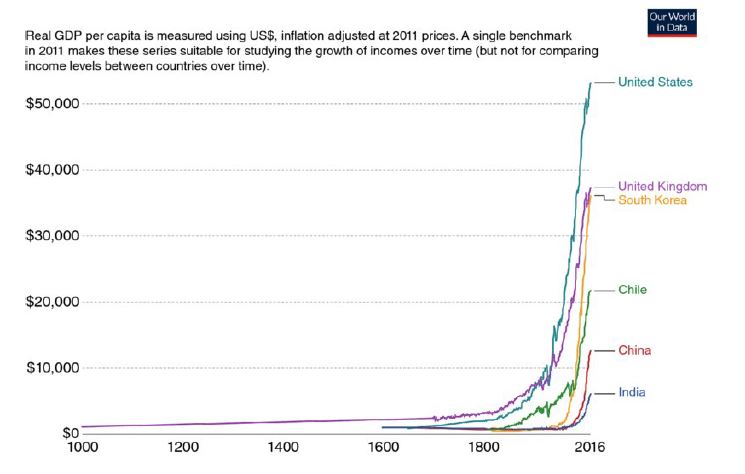
After clawing along for centuries, around 1820 humanity suddenly experienced a great enrichment due to technological advancements in energy, agriscience, health, and safety (Figure 2). Human history had never seen anything like it: the economy surged, growing consistently and quickly. From year 1 – 1820 AD, per capita consumption inched up, tripling over centuries. But when economic growth gained momentum in Western Europe, the U.S., Canada, Australia, and Japan, living standards doubled every two generations – a historic transformation (Siegel 2020).
Today, we are approaching a middle-class world. In Fewer, Richer, Greener, another book that takes a data-driven approach to human progress and problems, Laurence Siegel – Director of Research at the nonprofit, Chartered Financial Analyst Institute – writes about this dynamic economic growth:
This does not mean that half live at a standard we’d identify as middle class in the United States, or Britain, or France, or Australia. But it is not a state of hardship either. The Brookings Institute scholar Homi Karas defines middle class in this context as “people who have enough money to cover basic needs – such as food, clothing, and shelter – and still have enough left over for a few luxuries, such as fancy food, a television, a motorbike, home improvements, or higher education” (Long and Shaprio 2018, quoted in Siegel 2020: 98).

As supporting evidence, Siegel directs readers to another great Gapminder tool, Dollar Street. This website allows viewers to see images of families around the world in various income categories, including their homes, shoes, pets, water source, toilets, and many other aspects of daily life. Use the link at right to gain insight on conditions of life around the globe without leaving your living room (or office, as the case may be).
Transitioning Economies, Populations, and Technologies (oh my!)
This global transition from sick and poor to rich and healthy has had impacts far beyond the introduction of my grandmother’s toilet paper (glad as we all are for that!). Social scientists in the field of demography are tracking the global demographic transition that is occurring as parents are encouraged to have fewer children because they can count on their survival. Figure 3 pictures five stages of this process.
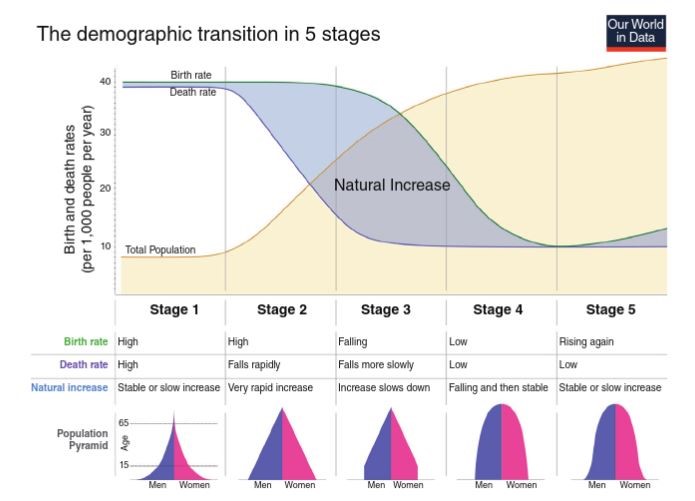
Stage 1 (circa 1800): Total population remains low as disease, warfare, and malnutrition kill people off as quickly as they are born. Not great!
Stage 2: Birth rates remain high, but death rates decline as societies make key improvements – such as separating wastewater from drinking water, advancing agriculture, enhancing healthcare, and establishing stable political systems. The total population grows rapidly.
Stage 3: With declining infant mortality, families have fewer children, allowing parents to invest more in each child’s health, education, and development. Population growth continues but starts to slow.
Stage 4: Births and deaths stabilize at a low level, and population growth levels off. Longevity increases, but very low birth rates (e.g., Italy) can create aging populations without enough young workers to sustain critical social services, like Medicare and Social Security.
Stage 5: In wealthy countries, like the U.S., U.K., and Nordic nations, fertility rates rise slightly as affluent households can afford larger “high-investment” families (Siegel 2020: 53).
A stabilizing global population is a good thing when we consider that this longer-living, better-invested, more-fulfilled populace is sharing a planet with finite resources. If you open any news app and search for the latest headlines about the environment, you’ll probably find plenty of alarming developments resulting from human consumption of natural resources. Without denying that challenges abound, it is also true that humans have continuously improved our ability to do more work with less energy, fewer materials, and a smaller environmental footprint.
This process, known as dematerialization, has been facilitated by technological innovations that have improved the efficiency of production processes over the past 200 years. Andrew McAfee, Principal Research Scientist at the MIT Sloan School of Management, discusses this in his TEDx talk, Dematerialization: Humanity’s Biggest Surprise.
It’s important that we continue this trend because, in the next hundred years, we will need to consume more resources, not fewer, if people in the remaining sick and poor countries of the world are to get their shot at pursuing rich and fulfilling lives.
Richer for Whom?
While a landscape of planetary betterment is emerging for many, there is certainly uneven realization of this potential across the world and in our communities. Neighborhoods provide the immediate environment for families, making them a critical dividing line of opportunity in America. There has been disjointed investment in neighborhoods, with some children growing up in places with safe schools, fun parks, upkept infrastructure, and trusted neighbors, while a stone’s throw away these features of the good life are absent.
This brings me to a key question: How does place shape opportunity in America?

I started becoming interested in this question during the three years I spent living in Hays, Kansas in my early career as a college professor. Hays is nestled in the agricultural heartland of the Great Plains, where the sun blazes up from the rolling, prairie grass horizon so large and bright – it’s like looking God in the face. Western Kansas can also really dish it out when it comes to severe weather, with winter storms pelting furious ice daggers and summer drought scorching the landscape brown. Conditions like these drove many homesteaders to early graves. The decedents of those who persisted on the plains are a truly tough stock.
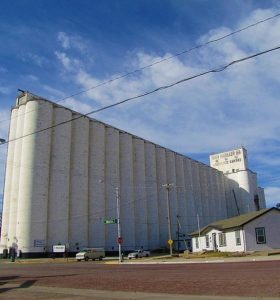
I once took a business trip to Hugoton, Kansas, deep in the southwest corner of the state. Every ten miles on my trip from Hays to Hugoton, towering grain elevators would come into view, hulking concrete milestones overseeing a vast sea of absolutely nothing. According to local Kansas lore, grain elevators were built every ten miles on state highways because that was as far as a horse-drawn wagon could travel round-trip in a day. As science and technology eventually reduced the number of jobs in agriculture, many of the once-thriving towns that emerged around the grain elevators have today been reduced to sad clumps of trailers with a church and a liquor store. So went the landscape for 200 miles, until I arrived at Hugoton – an oasis of prosperity built upon the largest natural gas field in the region.
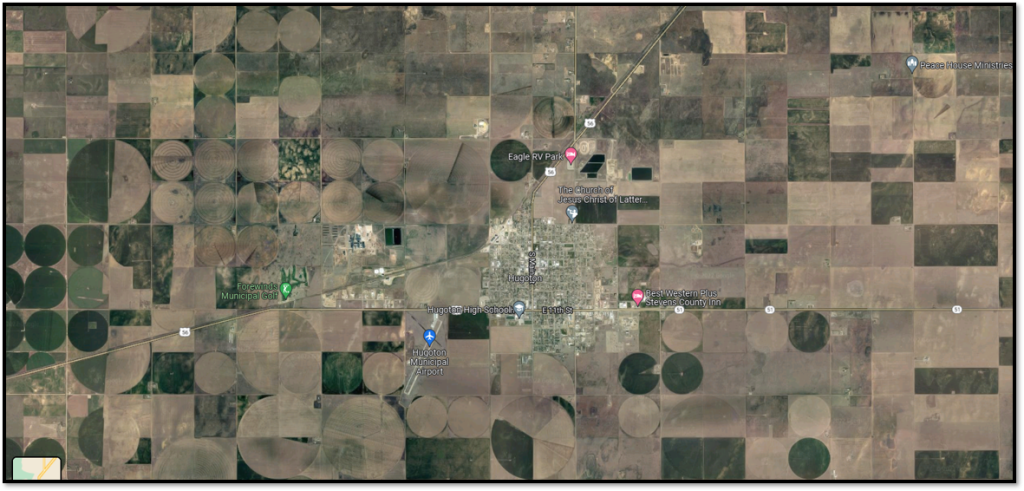
A statement from a SoIL landowner I spoke with about fracking flashed through my mind: “I think when you grow up with that understanding of what the oil provides, then I think you kind of have a better understanding as to how the harmony of it all works together” (Personal Interview, Illinois landowner).
It took a few years and this trip to Hugoton for his larger point to land. It is common to hear college professors and media mouthpieces decry the evils of capitalism, but economic development can mean the difference between a town that’s a dried-up wasteland and a town with a thriving Main Street, pointing to the community-wide benefits that free-market enterprises, like oil and gas development, can provide.
Without economic opportunities, those grain elevator towns dotting the highway held little hope for population growth. And without sufficient population, there is no money for nice things – infrastructure, schools, a nice Wesco with a slushy machine – forget about it. While some suburban communities are organizing to keep chain stores, like Walmart, from building in their neighborhoods, a Dollar General in a western Kansas town is a coveted sign of local prosperity.
In this respect, rural communities and urban, post-industrial communities have some unlikely commonalities. Unlike their rural counterparts, urban core communities have highly concentrated populations. However, they have historically lacked access to capital investments needed to improve infrastructure and launch businesses, resulting in a landscape of dilapidated housing, empty shop fronts, and broken sidewalks not so unlike the sad clumps of trailers dotting Kansas Highway 56.
From the Great Plains to the Great Lakes
The waters of the Great Lakes fueled the Industrial and Green Revolutions that catapulted human civilization into the modern era. The lifestyles we enjoy today came at heavy costs to Great Lakes ecosystems, which were timbered, tilled, and fished by European settlers with total disregard for long-term ecosystem impacts. It was this type of destruction that inspired modern management concepts like “sustainability” and “carrying capacity.” Hindsight is 20/20, they say.
But in their industrial heyday, the Great Lakes were treated like a giant toilet. Industrial byproducts and untreated sewage were discharged directly into their waters, which were believed to be so vast they were capable of dissolving anything. Commercial travel opened the formerly isolated inland lakes to the Atlantic Ocean and the Mississippi River, and ships traveling between water bodies transported invasive hitchhikers, like the quagga mussel, that have wreaked chaos on the Great Lakes food web (Egan 2017).
In the face of these challenges, the Great Lakes have also proved remarkably resilient. Through collaborative management, huge strides have been made toward restoration. An example close to home is Muskegon Lake, where the GVSU Annis Water Resources Institute is located. Learn more from the video Back from the Brink.
The industrial boom supported by the Great Lakes attracted European immigrants fleeing war and famine and, later, Black migrants escaping Jim Crow laws in the South (Collins 2021). During the Great Migration, Black laborers in Muskegon filled wartime labor shortages but were relegated to the most demanding and dangerous jobs, regardless of prior skills (Schaub 2009). Meanwhile, racially restrictive covenants barred Black residents from purchasing homes (Harris 2011), and direct violence further confined them to specific neighborhoods (Tolnay 2003).
In the 1930s, the Home Owners’ Loan Corporation (HOLC) compounded these limitations by assigning risk ratings to neighborhoods using color-coded maps, classifying areas as “best” to “hazardous” based on infrastructure conditions and racial composition (Mitchell and Franco 2022). You can explore these classifications by selecting the link below to open the Mapping Inequality project’s interactive map of Muskegon and Muskegon Heights.
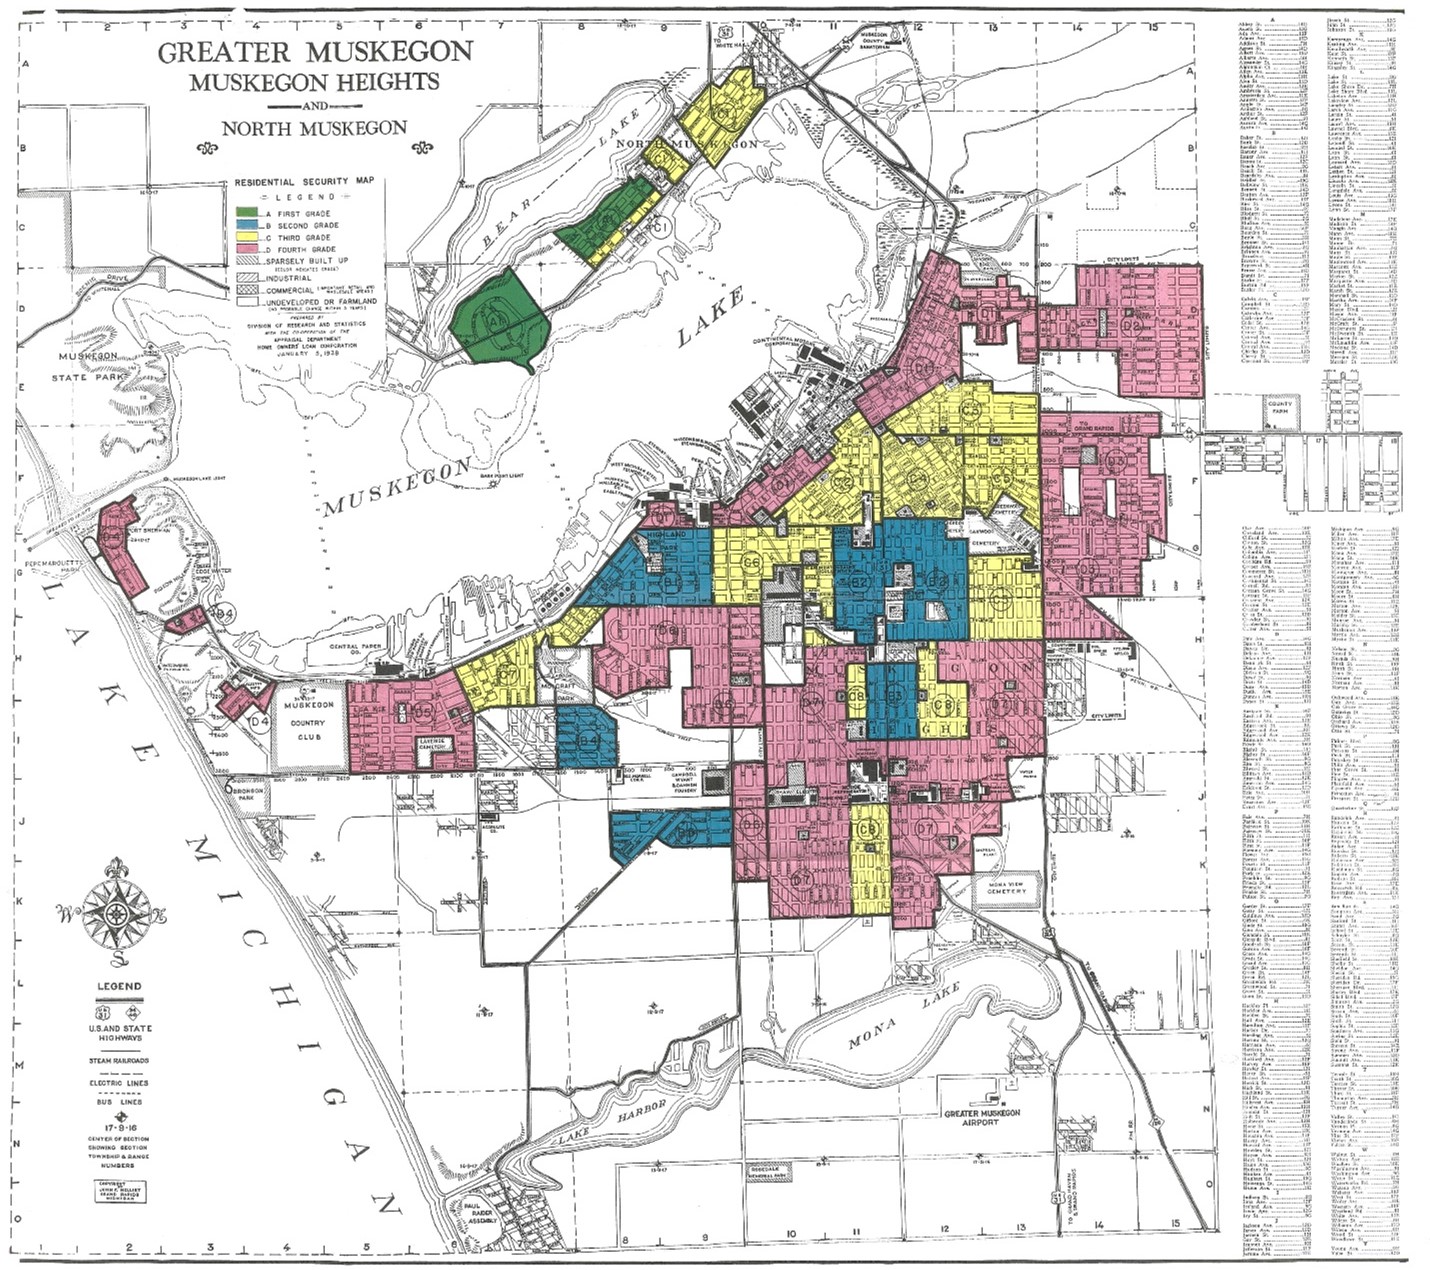
As you can see, physical characteristics of neighborhoods, such as the quality and upkeep of housing stock and public infrastructure, as well as the racial and ethnic characteristics of residents were used to classify neighborhoods as deserving or underserving of federal capital investments.
By restricting the mobility of Black residents and limiting their access to financing, redlining policies not only deepened economic inequalities but also increased the likelihood of communities of color being situated near environmentally hazardous industrial facilities (Mohai et al. 2009). Muskegon Heights, Michigan, located just south of Muskegon, exemplifies these patterns of combined economic and environmental threats.
The U.S. Census Bureau estimates that the city’s racial composition of approximately 10,000 residents is nearly inverse to that of Michigan and the U.S., with 75% identifying as Black or African American and 16% as non-Hispanic White. Median income is half the national level, and poverty rates are three times higher than the state and national averages (U.S. Census 2022).
Since 2021, my sociology colleagues and I have worked with a Muskegon Heights community group to support their development of community engagement and data management skills. Over six months, we met weekly with twelve community leaders, discussing key issues like intergenerational knowledge gaps in home ownership, the decline of Black-owned businesses, and economic self-sufficiency. Currently, we’re collaborating to press the State of Michigan to address hazardous waste leaching into a creek that runs through a popular local park. Remediation could open opportunities to restore the creek to a community asset. My work on this project has deepened my understanding of how legacies of economic and environmental vulnerability intersect with broader social risks, particularly for children growing up in poverty.
Mapping Opportunity in Michigan and Beyond
Kids that grow up in poverty are exposed to a snowballing set of social risks. In addition to receiving fewer economic investments, children in poverty are more likely to suffer from Adverse Childhood Experiences (ACEs), which impede their cognitive and socio-emotional development. They also may live in old, deteriorated housing where they are exposed to environmental illnesses like lead poisoning through outdated paint or old water pipes. They may play in parks and creeks contaminated with heavy metals and carcinogenic chemicals. These environmental hazards compound the problems faced by young people growing up in poverty.
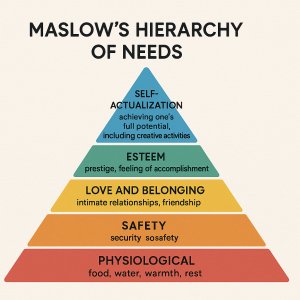
We all suffer when the most vulnerable members of our community suffer. According to the logic of Maslow’s hierarchy of needs (Figure 7), if our neighbor’s basic needs for food, shelter, and safety are unmet, they are incapable of realizing higher-order needs, including being a contributing member of our community.
I am convinced that there is widespread agreement that we need to support the vulnerable members of our communities. A critical point of partisan disagreement is about the role that the State should play in facilitating that support, versus relief efforts organized through the voluntary contributions of concerned and financially generous individuals. Press pause on the news dial and look around – you will find that reasonable people on all sides are working on solutions to support and uplift vulnerable groups.
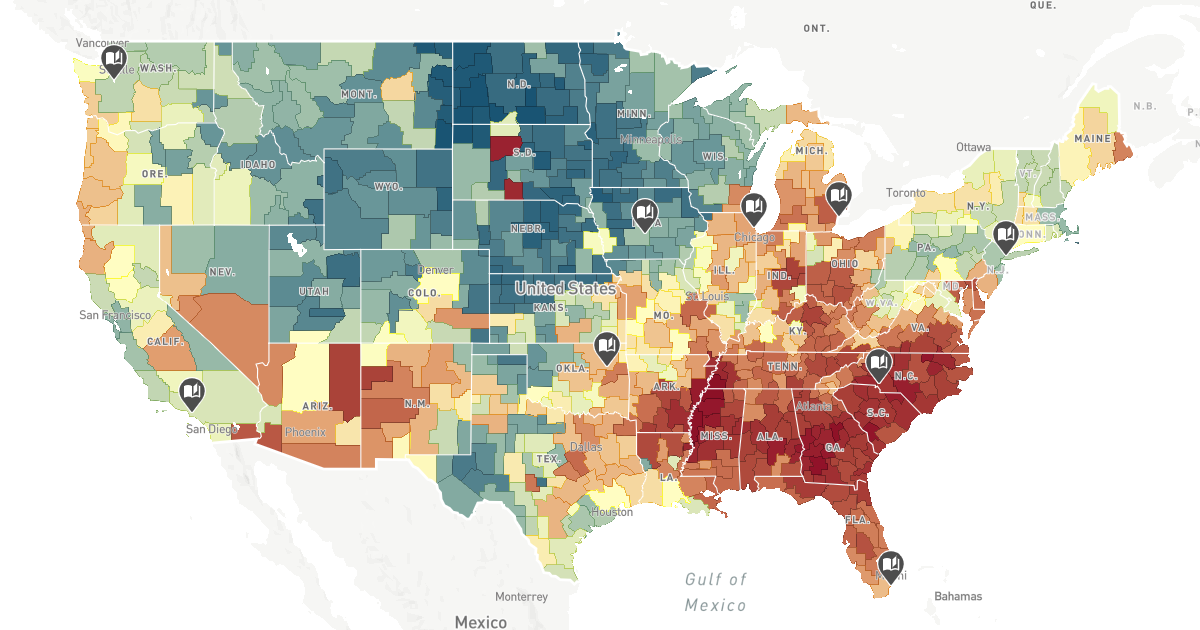
If we are going to be reasonable about getting to work on these problems, we need place-based data that allows us to pinpoint the location of communities where children are disproportionately at risk of experiencing adverse life outcomes and obstacles to opportunity – things like incarceration, teenage pregnancy, dropping out of school, or earning incomes below the poverty line.
The Opportunity Atlas is just such a mapping tool. Co-designed by data scientists affiliated with Opportunity Insights and the U.S. Census Bureau, the Opportunity Atlas asks, “Which places in America offer children the best chance to rise out of poverty?” This tool tracks pathways of opportunity by analyzing anonymous data on the life outcomes of U.S. citizens from childhood through adulthood. I particularly like Module 1, which focuses on SES outcomes for kids at the neighborhood level. Select the map below to explore the data.
Your assignment this week involves using this tool to examine locations of your choice, contrasting areas where children are more likely to encounter opportunity versus obstacles. By analyzing social and economic outcomes across different neighborhoods, you’ll explore how structural factors can influence life chances while also considering how individuals and communities navigate and push back against these constraints – a key aspect of “putting social problems in their place.”
In Sum
This chapter has explored the transformative period of rapid economic growth known as the Great Enrichment, emphasizing its profound impact on global living standards. Economic expansion has led to a demographic transition, as wealthier families have fewer children and invest more in each. Technological revolutions, including dematerialization, are further reshaping economies by reducing resource consumption per unit of economic output. It is, indeed, a happening time to be alive!
However, the benefits of enrichment have been unevenly distributed, creating stark disparities in opportunity across the planet and within the U.S. This chapter compares the declining economic prospects in rural Kansas with the industrial legacy facing urban Muskegon and Muskegon Heights, Michigan. By examining these place-based disparities across the rural-urban divide, the chapter underscores how geography shapes access to resources, opportunities, and quality of life.
References
Centers for Disease Control and Prevention. N.d. “Why is addressing social determinants of health important for CDC?” U.S. Department of Health and Human Services. Accessed 9 May 2025 (https://www.cdc.gov/about/priorities/why-is-addressing-sdoh-important.html).
Egan, Dan. 2017. The Death and Life of the Great Lakes. New York: W.W. Norton & Company.
Hanna-Attisha, Mona. 2018. What the Eyes Don’t See: A Story of Crisis, Resistance, and Hope in an American City. New York: One World.
Harris, Laurie Lanzen. 2011. Great Migration North, 1910-1970. Omnigraphics.
McAfee, Andrew. 2019. Dematerialization: Humanity’s Biggest Surprise. TED. May 2. Accessed 9 May 2025 (https://www.youtube.com/watch?v=uEQDLUdMb5M).
Mitchell, Bruce and Juan Franco. 2022. “HOLC ‘Redlining’ Maps: The Persistent Structure of Segregation and Economic Inequality.” NCRC. Accessed 13 July 2022.
Mohai, Paul, David Pellow, and J. Timmons Roberts. 2009. “Environmental Justice.” Annual Review of Environment and Resources 34: 405-430.
National Archives. n.d. The Great Migration. Accessed 9 May 2025 (https://www.archives.gov/research/african-americans/migrations/great-migration).
Rosling, Hans, Ola Rosling, and Anna Rosling Rönnlund. 2018. Factfulness: Ten Reasons We’re Wrong About the World — and Why Things Are Better Than You Think. New York: Flatiron Books.
Ruck, David J. 2019. Back from the Brink: A Muskegon Lake Film. YouTube. Retrieved May 10, 2025 (https://www.youtube.com/watch?v=n7HCN0RQK-w).
Schaub, James. 2009. Up From the Bottoms: The Search for the American Dream. Clear Vision Films, MI.
Siegel, Laurence B. 2020. Fewer, Richer, Greener: Prospects for Humanity in an Age of Abundance. New Jersey: Wiley.
Tolnay, Stewart E. 2003. “The African American ‘Great Migration’ and Beyond. Annual Review of Sociology 29: 209-232.
U.S. Census Bureau. 2022. American Community Survey 1-Year Estimates: Data Profile for Muskegon Heights, Michigan. Washington, DC: U.S. Department of Commerce. Accessed 10 May 2025 (https://data.census.gov/cedsci/).
A measure that reflects an individual's or family's social and economic position relative to others, based on factors such as income, education, and occupation. These indicators are commonly used in social science and health research, as health outcomes are often linked with social, economic, and environmental factors (CDC n.d).
Changes in birth rates and death rates that combine to influence total population (Siegel 2020).
Living to a ripe old age, not just surviving childhood (Siegel 2020: 128).
An increase in efficiency resulting in fewer inputs being converted to greater outputs (Siegel 2020: 358).
The mass movement of approximately six million African Americans from the rural Southern United States to urban centers in the North, Midwest, and West between 1910 and 1970 (National Archives, n.d.)
Prolonged, extreme, or repetitive stress or trauma, including poverty, racism, and violence, which chronically activates stress hormones and reduces neural connections in the brain during child development (Hanna-Attisha 2018: 25).
An environmental illness that causes developmental problems in children, including cognitive impairment, inability to regulate emotions, impulsive behavior, and health problems (Hanna-Attisha 2018).
