6 Survey Measures
Learning Objectives
This chapter will introduce you to the survey measures available in the West MI Watersheds Database. We will:
- Review basic principles of measurement in survey research.
- Identify concepts operationalized by survey questions in the West MI Watersheds database.
Statistical Measurement
The term statistics refers to a broad range of techniques and procedures for gathering, organizing, analyzing, and displaying quantitative, or numeric, data. In quantitative research, the data are expressed as numbers. This contrasts with qualitative data, which involves data expressed as text or photos (but you already know this from the previous chapter).
In the social sciences, variables refer to characteristics of people (or related phenomena) that differ, or vary. For example, age is a characteristic of individuals that varies and meaningfully impacts how people experience the world.
Level of knowledge about threats to water quality is another characteristic that can vary in a research population. Within the variable “water quality knowledge,” we may have different attributes that describe an individual’s level of knowledge, from “not at all” knowledgeable to “very” knowledgeable.
There are several distinctive types of variables based on their measurement characteristics, as summarized in the figure below.
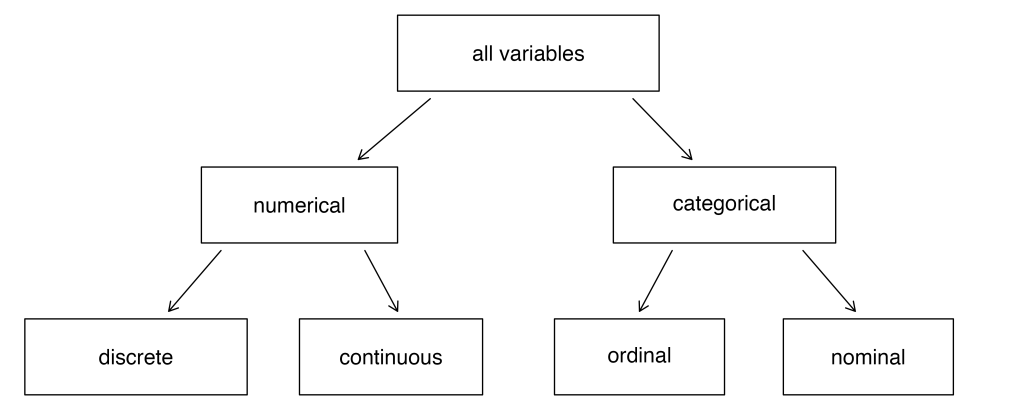
Numerical variables are measures that can be treated as, well, numbers. It makes sense to add, substract, or average values like number of acres of farmland, or miles driven to a favorite fishing spot. In contrast, a variable measuring the type of property someone owns may still be assigned a number in our dataset, (i.e., farm = 1, rural residence = 2, in-town residence = 3), but it doesn’t make sense to subtract 1 from 2 in this example because this is a categorical variable that doesn’t have a clear numeric meaning.
Numeric variables may be discrete, meaning they can only assume certain values. For example, the number of classes you are currently enrolled in is a discrete variable that can only be a whole number – you may be taking one, two, three, or four classes, but you can’t be taking 1.5 classes. In contrast, continuous variables can be any value. For example, height and weight can be fractions of a whole number.
Categorical variables may have a natural ordering, like a variable measuring education level whose attributes range from “less than a high school diploma” to “graduate degree.” This is an ordinal variable because characteristics are ranked according to magnitude on a continuum. However, while the values are on an ordered scale, the units of measurement are not equal values apart (which is how you know that it is a categorical variable rather than a numerical variable). In contrast, nominal variables assign people to categories that have a distinct numeric value, but the number assigned to each category is arbitrary. African American respondents are coded “1”, Asian respondents are coded “2”, and Hispanic respondents are coded “3,” for no particular reason.
How do Social Scientists Measure the Social World?
Returning to our earlier examples, age is a fairly straightforward characteristic to measure. We can easily ask people their year of birth or age and know that we all understand this as a measure of the number of years an individual has been alive. However, “level of knowledge” about something is a wee bit of a mushier measure. These more abstract things that social scientists often measure are called constructs. Constructs can’t be observed directly with the naked eye or indirectly, as in our example of asking someone their date of birth to measure age.
Instead, constructs must be operationalized through a process of defining the concept one wishes to measure, specifying the research procedures we 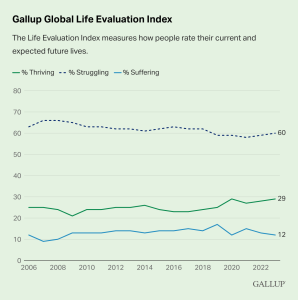 will use to gather data about our concepts, and identifying indicators that will be taken to represent the ideas that we are interested in studying.
As an example, use the link in the button below to take a look at how Gallup, an internationally renowned research firm, measures the concept “well-being” pictured in the Global Life Evaluation Index figure at right.
As you may have guessed, developing indexes that operationalize abstract constructs is a difficult job to do well. Firms like Gallup use measures that have been tested, refined, experimented with, and iteratively developed over many years. This helps social science researchers achieve greater reliability with our measures, meaning that we are achieving a consistent level of measurement from one research participant to the next, and validity, which means that we are measuring what we intend to measure.
As an example of this point, let’s take one of the measures in the West MI Watersheds Database – use of septic system best maintenance practices. One way that this is measured is asking survey respondents how often they have their septic tank inspected by a sewer/septic professional. Answer options range from “never” to “every 3-5 years.” Can you think of any potential problems with the reliability and validity of this measure?
Regarding reliability, asking people to recall past behaviors is notoriously problematic (Dillon, 2014). I can’t tell you what I ate for lunch yesterday, let alone provide an accurate account of my home maintenance schedule from memory. Further, some people may misunderstand the meaning of this question and think that, because they diligently have their tank pumped every 3-5 years, they are also receiving a system inspection (they’re not!). So, they may answer based on a different understanding of the question than was intended by the researcher. These are potential liabilities of the measure that must be acknowledged and improved in the future.
Concepts Measured in the West MI Watersheds Database
The variables available in the West MI Watersheds Database cover several broad conceptual categories and vary by survey location. To get the best sense of the information available within each dataset, you will need to spend some time browsing the copies of questionnaires presented to survey respondents. A rough summary of the concepts for which there are measures available within each watershed follows.
| Concepts Measured | Available Datasets |
| Water-based recreational activities | PRW, MAC, CCS, PENT, MAN, MML, MWL |
| Stewardship attitudes | PRW, MAC, CCS, PENT, MAN, MML, MWL |
| Perceptions of water quality and impairment | PRW, MAC, CCS, PENT, MAN, MML, MWL |
| Use of BMPs | PRW, MAC, CCS, PENT, MAN |
| Information sources | PRW, MAC, CCS, PENT, MAN |
| Trust in management agencies | PRW, MAC, CCS, PENT, MAN |
| Perceptions of neighborhoods | MML, MWL |
| Visits to lake | MML, MWL |
| Attachment to neighborhood/lake | MML, MWL |
| Opinions about AOC impacts | MML, MWL |
| Demographic characteristics of participants | PRW, MAC, CCS, PENT, MAN, MML, MWL |
Summary
Statistical data represent concepts as numbers. Variables measure characteristics that differ among people in the data and are classified differently based on the characteristics of measurement they achieve. Identifying the type of variable you are working with is important because, as we’ll see later on, it will determine the analytic technique that can be used. In social science research, variables measuring abstract complex must be carefully operationalized to ensure that they reliably and accurately measure the intended concepts they are meant to represent.
References
Çetinkaya-Rundel, M. and Hardin, J. (2024). Introduction to Modern Statistics, 2e. OpenIntro. CC-SA 3.0 (https://openintro-ims.netlify.app/).
Dillman, D. A., Smyth, J. D., & Christian, L. M. (2014). Internet, phone, mail, and mixed-mode surveys: The tailored design method (4th ed.). John Wiley & Sons.
Kranzler, J.H. (2017). Statistics for the Terrified (6th ed.). Roman & Littlefield.
Saylor Academy. (2012). Principles of Sociological Inquiry: Qualitative and Quantitative Methods. CC-BY-NC-SA 4.0 (https://saylordotorg.github.io/text_principles-of-sociological-inquiry-qualitative-and-quantitative-methods/index.html).
Sheppard, V. (2020). Research Methods for the Social Sciences: An Introduction. Pressbooks. CC-BY-NC-SA 4.0. (https://pressbooks.bccampus.ca/jibcresearchmethods/).
Techniques and procedures for working with quantitative data.
A collection of information.
Characteristics that can take on different values.
Properties of a variable.
Variables that can take a wide range of numerical values which can be used for mathematical computations (i.e., add, subtract, or take averages).
Variables with categories that, while assigned numbers, can not be used to make meaningful mathematical computations.
Numerical variables that can take on certain numbers with jumps, as in whole numbers.
Numerical variables that can take on any value, including fractions of a whole number.
A variable that ranks people or objects on an ordered scale with the units of measurement being mathematically unequal between categories.
Variables that assign people to categories that have a distinct numeric value, but the number assigned to each category is arbitrary.
Measures in social science research that are not observable, directly or indirectly.
The process by which we spell out precisely how a concept will be measured (Saylor, 2012).
Achieving consistency in measurement, such that if the same measure is applied consistently to the same person, the result will be the same each time (Sheppard, 2020).
Achieving certainty that our measures accurately get at the meaning of our concepts (Shepphard, 2020).
