5 Survey Methods
Learning Objectives
This chapter will introduce you to the survey methods used to collect data for the West MI Watersheds Database. We will:
- Distinguish qualitative and quantitative research methods
- Compare and contrast random sampling and nonprobability sampling methods
- Review questionnaire design and distribution, WMW Database
- Identify sources of measurement error and bias in research design
What are Survey Research Methods?
Research methods are techniques used to collect data and, in the social sciences, analyze phenomena related to the social world. In the social sciences, research methods may be quantitative, qualitative, or a mix of both methods.
| Quantitative Methods | Qualitative Methods |
| Tests a hypothesis | Uncovers deeper meaning |
| Measures created systematically before data collection | Measures specific to the individual setting |
| Data in numeric form | Data from texts, images, observations, and/or transcripts |
| Procedures standardized, replication assumed | Procedures particular and replication is difficult |
| Analysis uses statistics to test relationships between variables | Analysis identifies themes and patterns |
| Read more: Research Methods for Social Sciences | |
Among quantitative research methods, survey research refers to the use of standardized questionnaires or interviews to collect data that are converted to numeric values for statistical analysis (Bhattacherjee, 2012: 73).
We are all familiar with surveys because this method is so commonly used to collect data. From social science research, to consumer satisfaction or user experience surveys, and even course evaluations – you are probably asked to fill out a survey every time you turn around! But did you know that not all surveys are created equally?
When executed effectively, survey research can tell us a lot about a population of interest by only getting input from a small subset of that population. But there are several sources of error in survey design and execution that can compromise the integrity of survey data. Given how much of our information environment is saturated with survey data, it’s very important to be able to distinguish quality research methodology from crap.
Survey Sampling
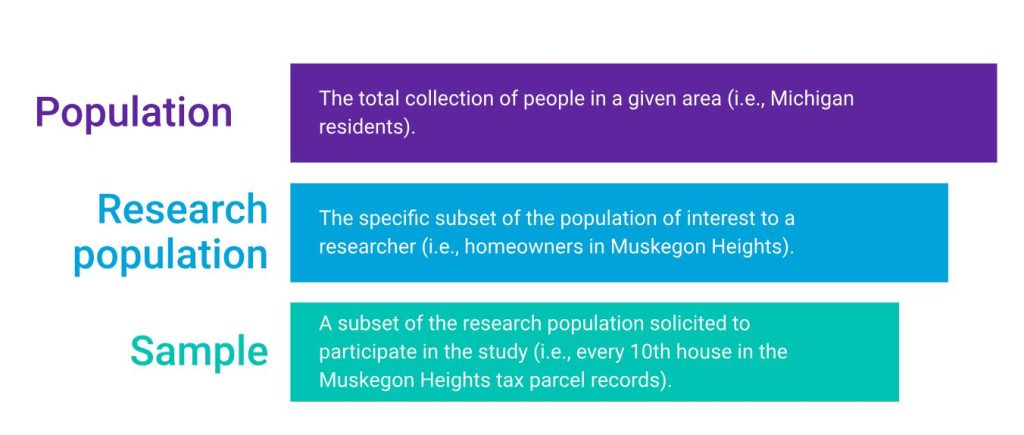
Most surveys include a sample of people, which is a small number of individuals from the population who are systematically selected to participate in a study.
For example, rather than mailing a survey to all 10,000 residents in the Pigeon River watershed, which would be very expensive, we obtained a list of all property owners in the watershed and used a random number generator to draw a sample of 900 residents, who were mailed a copy of the survey.
In this example, there are three population scales we can consider. First, there is the broader population of all Michigan residents, from within which we are interested in Pigeon River watershed residents – our research population. The subset of 900 Pigeon river residents who were randomly selected to receive a questionnaire in the mail represent the research sample.
There are a variety of sampling techniques that are used in survey research.
Probability sampling is common in quantitative research because it enables researchers to generalize results from the sample to a broader population.
- Random Sampling: All individuals in the defined population of interest have an equal chance of being selected to participate in the study. This ensures generalizability of the sample to broader populations. Learn more in the Pew Research Center video, Methods 101: Random Sampling.
To draw a random sample that can be generalized to a broader population (the research population), the researcher must have a complete list of all people that belong to the research population. This is known as the sampling frame. If the sampling frame is incomplete or does not accurately represent the population of people of interest to the research questions, the survey results cannot be said to represent the average experience of that population, no matter how many responses the researcher receives. Common lists used to draw sampling frames include tax parcel records of property owners, email addresses for organization/institution members, client lists for service providers, phone numbers (more problematic due to cell phones and unlisted numbers).
In contrast, nonprobability sampling is common in qualitative research because the goal of the research is in-depth description rather than generalization. Nonprobability sampling techniques include:
- Convenience Sampling: Reliance on people who are available to the researcher(s), have important insight on the topic, and are willing to participate.
- Snowball Sampling: Method of recruitment based on referral by other research participants.
- Purposive Sampling: Respondents selected because of specific characteristics related to the goals of the research.
Survey Design
The surveys included in the West MI Watersheds Database utilized the Tailored Design Method, a strategic approach to survey design developed by Don Dillman to increase participation in survey research. In a perfect world, everyone would be thrilled that you bothered to ask them what they think, need, or experience day-to-day. In the real world, getting people to complete a survey can be extremely challenging.
The Tailored Design Method emphasizes 1) social exchange theory; 2) personalized, frequent contacts; and 3) allowing multiple response modes. Let’s break each component down.
Social exchange theory assumes that people are more likely to respond to a request to complete a survey if the perceived rewards or benefits of participating outweigh the perceived costs. Researchers can reduce costs/increase rewards by:
- Asking interesting questions
- Making questionnaires easy to navigate
- Providing cash incentives
- Explaining the importance of the research
Personalized correspondence helps instill trust and legitimacy by:
- Addressing the recipient by name
- Providing the researcher’s credentials
- Expressing gratitude and deference
- Letting the recipient know that other responses have been helpful
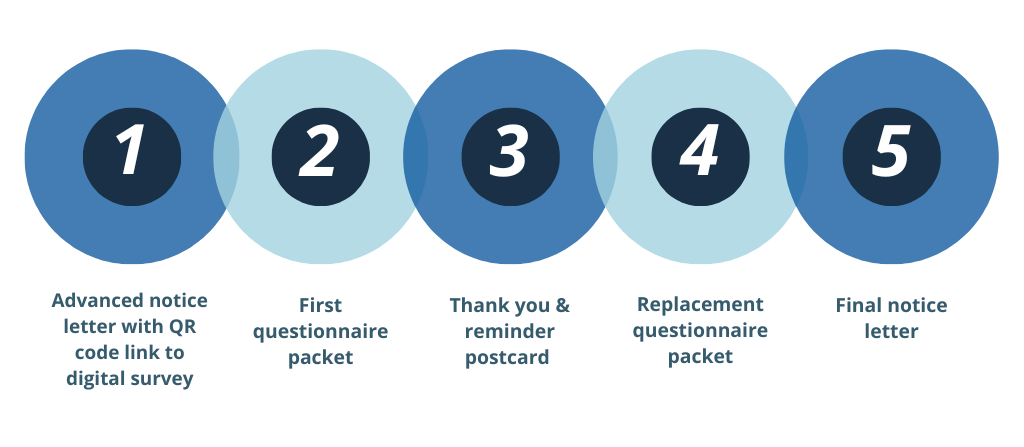
Five contact attempts are recommended at 1-2 week intervals, with the type of contact varying each time to capture attention. For example, potential survey participants first receive a letter explaining the study and notifying them that a survey is coming. They next receive a paper survey packet with a postage paid return envelope. This is followed by a post card thanking people who have responded and reminding those who have not sent back their completed packet to do so. If the project budget allows, a replacement survey packet is sent 1-2 weeks later, followed by a final letter notifying recipients that the study is coming to a close and requesting that they mail back their completed surveys.
Greater rates of response can be achieved using mixed modes of collection that allow respondents multiple options for completing the survey. Conventionally, this has been done using a combination of mail and phone surveying. Increasingly, mail surveys are offering a digital completion option.
Sources of Bias and Error
Survey error is the difference between an estimate produced by survey data and the true value of the variables in the study population (Dillman, 2014). Four types of error can compromise the accuracy of survey results.
- Coverage error: occurs when the list from which the survey sample was drawn did not accurately represent the study’s target population.
- Sampling error: occurs any time a sample of units is used to produce estimates instead of surveying every unit; some difference between the sample and the population is always expected.
- Nonresponse error: occurs when people who do not respond to a survey are different from those that do respond.
- Measurement error: occurs when respondents are unable to give accurate answers because of poor questionnaire design.
Summary
Survey research is a quantitative methodology that can be used to make inferences about broad populations. The generalizability of survey data depends on the sampling technique used. The Tailored Design Method is considered the gold standard for survey design and distribution in the social sciences. Effective recruitment strategies ensure that the results of survey research can be generalized to broader populations and reduce estimation errors and bias. Reducing the costs of participation, making frequent contacts, and offering multiple completion modes can help improve response rates. Beware of coverage, sampling, nonresponse, and measurement error, which can compromise the accuracy of survey results.
References
Bhattacherjee, A. (2012). Social Science Research: Principles, Methods, and Practices Textbooks Collection. 3. (https://digitalcommons.usf.edu/oa_textbooks/3).
Çetinkaya-Rundel, M. and Hardin, J. (2024). Introduction to Modern Statistics, 2e. OpenIntro. CC-SA 3.0 (https://openintro-ims.netlify.app/).
Dillman, D. A., Smyth, J. D., & Christian, L. M. (2014). Internet, phone, mail, and mixed-mode surveys: The tailored design method (4th ed.). John Wiley & Sons.
Sheppard, V. (2020). Research Methods for the Social Sciences: An Introduction. Pressbooks. CC-BY-NC-SA 4.0. (https://pressbooks.bccampus.ca/jibcresearchmethods/).
Techniques and tools used to collect and analyze data.
A small number of individuals who are systematically selected to participate in the study.
Everyone who is impacted by or related to the subject of the study.
The systematic method used to determine who is eligible to participate in a study.
A list of all members of the research population from which a sample is drawn.
A method of survey design that increases participation by reducing costs, increasing benefits, and inspiring trust.
