5 Reading Electrocardiograph Rhythms
Sinus Rhythms and Premature Beats
The electrocardiograph (ECG), or if you are feeling German today “elektrokardiograph” (EKG) is an instrument that simply reads voltages recorded through electrodes placed at specific locations on the body. In the chapter related to diagnostic stress testing, you learn about these specific locations. The recorder itself used to be a simple stylus printing ink or even a hot wire burning a black line on grid paper that is being fed through the unit at a specific speed (25 mm/sec). As the recording electrode picks up signals from the heart during its cardiac cycle, the positive, negative or lack of signal would be recorded on the paper. Therefore, the electrocardiograph is a means to visually graph the electrical patterns during repeated cardiac cycles.
3 simple rules
In order to understand the movement direction of the cardiac signal, we only need to remember 3 simple rules.
|
|
|
|
These rules will make more sense when we start looking at different arrhythmias, different leads, and the orientations of the QRS complex. We will come back to these later. |
Constructing the Cardiac Cycle
If we look at the steps in a complete cycle of atrial and ventricular depolarization and repolarization, you can see the ECG draw the wave patterns:
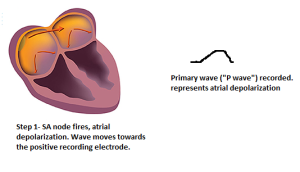
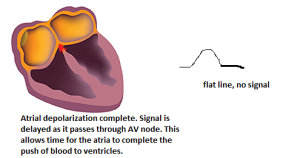
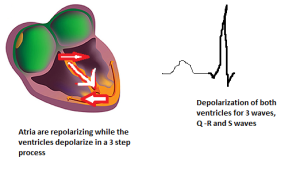
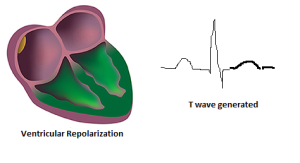
There you have it! So, the Electrocardiograph is simply documenting the repeating cardiac cycles for atrial and ventricular depolarization and repolarization! Depending on where the recording electrode is placed, these may look different. But that’s for another chapter (Chapter 9).
Calculating Rate: Atrial and Ventricular Depolarization Rates.
The ECG paper is a grid, with “small boxes” 1mm square, and “large boxes, which are 5×5 small boxes surrounded by a darker line. The magnitude (y axis) measures give us the magnitude of a wave. The x-axis is time-based, so we can calculate the duration of events and time from one event to another (i.e. heart rate).
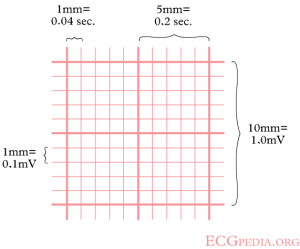
Paper Speed- paper speed is standardized to 25mm per second, or 1500mm/min (remember this number- you will use it!)
To determine heart rate (both atrial and ventricular) we simply need to measure the time interval, or the number of small boxes between two successive waves. Let’s try it! Use Figure 6.
Atrial Rate- Step 1 -We need to count the number of boxes between successive P waves. You can count by small boxes, or if you can see well enough count by large boxes (which are 5 each). When I counted I got 30 small boxes. Am I right… ? What did you get?
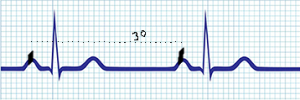
Atrial rate calculation– Now we simply take the paper speed and divide by the number of boxes ‘per beat (from one cycle to the next): 1500/ 30= 50bpm.
Likewise for ventricular rate, we simply measure from one R wave to the next:
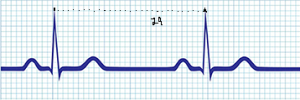
For ventricular rate I got 29! Counting boxes will take good vision and careful measurement, but there will be beat to beat variations. In regularly paced rhythms this is common, but they will be within 3 beats of each other. But in arrhythmias, there may be wide differences in atrial and ventricular rates!
Ventricular rate- 1500/29= 51.7 bpm ROUND THE VALUE: 52 bpm
One other method. The Dark Line
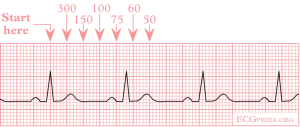
Using the same math as above, there is a quick way to get a general estimate of heart rate by quickly counting the distance between 2 cycles by the number of dark lines between them. Remember, the dark lines are the larger 5x 5 boxes.
Imagine if the distance between two R waves was one dark line ( equal to 5 small boxes). That would be 1500/5 = 300bpm. What is the distance was two dark lines? 1500/10= 150bpm. If you want to fill your memory a bit, you can simply count the dark lines number between two cycles and remember the computed math: 300.. 150, 100, 75.. and so on (see figure 8). If the cycle falls between one of them, you simply have reasonably close estimate of the rate. In the figure example the count happens to fall very near 100 bpm.
Sinus Rhythms
The word “sinus” means something in ECG rhythm naming! Include it in the naming of the rhythms to come.
The typical pacemaker of the heart is the sino-atrial node. This tissue sets the pace for both the atrial and subsequently (via AV node) the ventricles. So, a “sinus” rhythm is one that indicates an SA node paced rate. There can be other pacemakers of the heart in clinical conditions, so if it is indeed a sinus paced rhythm, include that in the name! Question- do you remember which wave represents the atrial sinus depolarization (hint : it is the “Primary” wave). So if you have a P wave with each QRS complex, we know it is paced by the SA node and is a sinus rhythm.
A “regular” rhythm
If you feel your pulse and (let’s assume) you are in a sinus rhythm, it is an even or regular paced rhythm. We use that word “regular” a bit loosely since a healthy heart does vary in its rate due to the continual influence of the sympathetic and parasympathetic nervous system. However, the differences are small.
Two questions to ask yourself when determining if it is a sinus rhythm:
- Is each P wave associated with a QRS complex?
- Is the rhythm regular, or evenly paced?
Always start an assessment of a strip by trying to answer Yes or No to these two prompts.
Normal Sinus Rhythm

Look at the rhythm above (Figure 8). I have identified the P wave, the RS wave and the T wave. Take note of their shape so you can track each across the strip. Note also the dark marks I placed on one P-P cycle and one R-R cycle.
Answer 2 questions:
- Is each P wave associated with a QRS complex? YES!
- Is the rhythm regular, or evenly paced? YES!
Let’s do the rates:
Atrial rate- number of small boxes between P-P= ___________ 1500/ ____ = ________ bpm atrial rate
Ventricular rate- X boxes between R-R= _____________ 1500/____ = ________ ventricular rate

How did you do? Within 3 beats of what I got? Then you are probably doing it correctly.
Definition of Normal Sinus Rhythm:
- Each P wave is associated with a QRS complex.
- The rhythm is regular.
- The rate is between 60-100bpm.
Sinus Bradycardia

Definition of Sinus Bradycardia:
- Each P wave is associated with a QRS complex.
- The rhythm is regular.
- The rate is less than 60bpm.
What if there is a p wave with each QRS, the rhythm is regular, but the rate is less than 60 beats per minute? Then we have sinus bradycardia.
What might cause a heart rate to be low? In healthy active individuals, aerobic training causes an increase in vagal tone (Parasympathetic Nervous System). This has one effect of reducing resting heart rate, and typically is not accompanied by any symptoms. On the other hand, some medications (like beta blockers) or heart disease conditions can also cause sinus bradycardia, along with symptoms of reduced cardiac output and low blood pressure. Symptoms may include dizziness. So always view the sinus rhythm in relation to the patient history. Try to assess the rate of the Sinus Bradycardia in Figure 9. The P, R and T waves have been identified, as it is always important to first assess the rhythm strip to be sure you know which waves you are looking at. Try measuring one cardiac cycle, then check your results below.
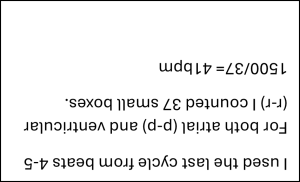
Did you get results close to mine (within 3 beats)? If not, go back and try again. If you used a different cardiac cycle, the differences might be variations in heart rate. We probably should take an average of a few beats, rather than just one cycle. We will do that for the next one.
Sinus Tachycardia

Definition of Sinus Tachycardia:
- Each P wave is associated with a QRS complex.
- The rhythm is regular.
- The rate is greater than 100bpm.
You can tell at first glance that this heart rate is faster. It might look a bit different (why is the QRS upside down?). You will get used to this as we move along. Different leads of the ECG will show us different looks. This is why you must always first examine the strip to identify the P, QRS and T waves. I have done it for you above.
In a healthy heart, variations even beat by beat in heart rate occur. For this reason, I want you now to take an average of 3 cardiac cycles for both atrial rates (p-p) and ventricular rates(r-r). For our first effort, I have marked the spots to work from. On the right side of the strip, I have marked a starting P wave, then I jump across 3 cardiac cycles to the mark on the last P wave. Count the boxes, get an average per cycle and find a rate.
Here’s what I got:
Atrial rate= I counted 43 boxes across 3 cycles, so 43/3= 14.3 boxes per cycle average
1500/14.3= 105 bpm
Ventricular rate (left side of strip r-r)= I counted 41 boxes across 3 cycles, so 41/3 = 13.7 boxes per cycle average
1500/13.7 = 109 bpm
See how even using an average can get different values? I guess I should have used the same cardiac cycles for both atrial and ventricular rates. Oops, I’m sure you will fix that error and just use the same cycles for both measures. But now we can see why taking an average is probably best, due to natural fluctuations in rate.
Sinus tachycardia is commonly seen during physical activity, as the sympathetic nervous system (SNS) is activated and increases in cardiac output are needed. However, in some clinical conditions, such as heart failure, or other instances of increased SNS activity you may see sinus tachycardia at rest. Stimulants that may be part of asthma treatment can also cause sinus tachycardia at rest, as well as significant dehydration (due to reductions in blood volume). Again, view the rhythm in the context of the individual when it was taken.
Summary Try a few on your own!
This time, try to use an average of 3 cardiac cycles (best to keep the same 3 for both atrial and ventricular). Give the rates and your Interpretation. Use Figures 11-13

- Atrial Rate:___ Ventricular Rate:___ Interpretation ________
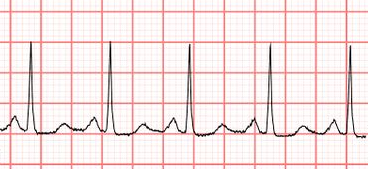
2. Atrial Rate:___ Ventricular Rate:___ Interpretation ________

3. Atrial Rate:___ Ventricular Rate:___ Interpretation ________
Answers (did you take averages of 3 cardiac cycles? I did!)
![]()
Premature Contractions: Other cardiac cells firing before the SA node
Because the SA node has the fastest rate of depolarization, it is the standard pacemaker of the heart. However, any cardiac cell can potentially become a pacemaker for the cell, due to the automaticity of each cell. In the cases of premature contractions, cells other than the SA node fire during a moment when the SA node has not yet fired, but the cells are ready to accept a signal.
Premature beats originate in different locations, typically in the atrial cell, AV node or ventricle. The premature beats will have distinct characteristics indicating their location.
Note the early beat as well as the pause!
Premature beats will fire before and expected sinus beat, so your eye may catch the change in rhythm. Additionally, after the premature beat there is a pause or delay before the SA node fires. You may note the pause and find the premature beat that way. Premature beats are also called “ectopic beats” since they fall outside the underlying rhythm. Individuals might also say they felt a “palpitation”, or a stronger contraction. This is probably the beat that comes after the premature beat. This is due to the long pause, which allows more diastolic filling of the ventricle, and therefore a stronger contraction that may be felt by the patient.
Premature Atrial Contraction (PAC)

Look at the image above (figure 14). On the left-hand side, we see the underlying rhythm, in which there is a P wave with each QRS and the rhythm is regular. If we determine the rate, we can identify the rhythm. We will do that in a moment.
Do you see the premature beat? If you track the rhythm from left to right, you can see the 4th beat is arriving early. That is a premature beat! Then you will see a long pause before the SA node takes over. Notice that the QRS complex looks just like the other beats. This is because the premature initiating signal is coming from above the ventricle and is being conducted into the ventricle via normal conduction pathways.
Note the premature beat has a P wave. This is key and tells us that the initiating signal came from the atria.
So, lets figure the entire rhythm and interpretation:
Note- when you are calculating the underlying rhythm, do NOT include the premature beat! This is just a one-off beat, and not part of the underlying or ongoing rhythm. I have placed purple parentheses around the area (Figure 14) where you should work.
Atrial rate (average 2 cycles): 76boxes/2= 38 1500/38= 39 bpm
Ventricular rate: 76boxes/2= 38 1500/38= 39 bpm
Now we summarize our interpretation. Identify the rhythm AND any anomalous beat. Give a tally of how many anomalous beats.
Interpretation= Sinus Bradycardia with 1 Premature Atrial Contraction (or PAC)
Premature Junctional Contraction (PJC)
This premature beat is still above the ventricle, so the initiating signal is sent through the normal ventricular conduction pathways. Therefore, the QRS complex will look like other beats. However, since the AV node is the source of the initiating signal, you have the signal moving in 2 directions, much like dropping a pebble into a pond. The signal enters the ventricular conduction pathway, but also is conducted backward (“retrograde”) into the atria. This results in an upside-down p wave. This retrograde P wave is indicative of a pacing coming from the AV junction.

Look at the rhythm above (figure 15). The first two beats are sinus beats, followed by a premature junctional contraction (PJC). Note the upside-down or retrograde P wave, followed by a pause, and then sinus rhythm is restored.

In some cases, the junctional beat is not conducted retrograde, so there is no p wave at all, just a flat line. The arrows identify the two PJCs in this example.
Try to determine the rate, rhythm, and interpretation of this Figure 16 strip. Avoid the PJCs! Maybe use the left side of the strip to find the underlying rhythm. I will do the same, using a sample of 3 cycles starting from the left. Check your answer with mine:

Premature Ventricular Contractions
Premature contractions originating from the ventricles show a significantly different look compared to PACs and PJCs. In the case of a PVC, there are no p waves visible, and the conduction of the ventricular premature beat does not pass through the fast conduction system. Instead, it is conducted slowly across the ventricle, leading to what is termed “wide and bizarre” QRS complex. The PVCs tend to jump off the page as you look at the strip. Can you see the two PVCs below (figure 17)?

If you try to assess the underlying rhythm, avoid the premature beats in your rate calculation (maybe average 2 cycles starting from the left?). This is because those beats are just sporadic, and to include them in a small sample of beat will cause rate error, The rhythm above is Normal Sinus rhythm with 2 PVCs (try checking the rates).
Unifocal vs multifocal

Look at the figure above (figure 18). Can you see that the underlying rhythm is a sinus rhythm, but there are a total of 3 premature ventricular contractions (PVCs) included. Note the early onset of the PVCs to the sinus beats. Note especially that the PVCs do not all look the same. This means that the location, or the “focus” of the PVCs differ. More than one location is a higher risk compared to one location, so we need to make note of this. We use the descriptive terms Unifocal to denote “same focus” and Multifocal, meaning multiple foci or locations.

Let’s assess the strip (figure 18b). First, underlying rhythm. We can do this by looking at the average of 2 cycles cross beats 5,6 and 7 moving left to right. I have made some dark marks identifying where to measure from.
Atrial rate 107 Ventricular Rate 107 Interpretation Sinus Tachycardia with 3 multifocal PVCs
Ventricular Couplets
Ectopic or premature beats can ultimately be the source of some very dangerous heart arrhythmias. While we all may have isolated PVCs on occasion, when the beats begin to combine into a sustained rhythm, the risk of sudden death increase. Therefore, premature beats that are paired, especially in the ventricle are cause of concern. These are known as Ventricular Couplets and are identified as ectopic beats that are paired together (back to back) without any sinus beat between them. Couplets may form in the atria or the ventricle. We will focus on ventricular couplets, due to their significant risk and link to fatal heart arrhythmias. Look below:

Using the two sinus beats in the center of the strip, we can get one cardiac cycle and the sinus rate:
Atrial rate 83 Ventricular rate 83
Interpretation Normal Sinus Rhythm with 2 Unifocal Ventricular Couplets
Note the two sets of couplets. These are back to back, or paired PVCs. Do the paired beats look the same (unifocal) or different (multifocal)? They look the same to me!
Practice Strips! Give them a try.


Answers! Ok, no more standing on your head to see the answers. But don’t peek until you try the practice strips!
Figure 20. Atrial Rate 125 Ventr. rate 125 Interpretation Sinus Tachycardia with 2 unifocal PVCs
Figure 21. Atrial Rate 86 Ventr. rate 88 Interpretation NSR with 1 PJC
Figure 22. Atrial Rate 35 Ventr. rate 35 Interpretation Sinus bradycardia with 2 multifocal PVCs
Figure 23. Atrial Rate 88 Ventr. rate 88 Interpretation NSR with 2 multifocal ventricular couplets
Figure 24. Atrial Rate 71 Ventr. rate 71 Interpretation NSR with 2 PJCs
Figure 25. Atrial Rate 107 Ventr. rate 107 Interpretation Sinus tachycardia with 1 PAC
Selected Sources
Goldberger’s Clinical Electrocardiography: A simplified approach 10th ed. Goldberger A., Goldberger, Z, Shvilkin A. Elsevier pub. ISBN-10 0323824757 2023.
Clinical Exercise Electrocardiography – Levine S., Coyne B., Colvin L. Jones & Bartlett Learning Pub. ISBN-10 1284034208 2015.
Life in the Fast Lane https://litfl.com
ECG of the Week https://hqmeded.ecg.blogspot.com
Meaning “one focus” or one location. Used in terms of premature beat locations. If two PVCs look the same, they are unifocal.
Many locations. In ECG terms, this refers to premature beats that come from more than one location. For example, if two PVCs occur but they look different, then they came from different locations, and we refer to them as multifocal PVCs.
Meaning “one focus” or one location. Used in terms of premature beat locations. If two PVCs look the same, they are unifocal.
