10 Selected 12 Lead ECG Anomalies
Myocardial Ischemia and Infarction
Conduction Defects in the Bundle Branches
Left Ventricular Hypertrophy
Interpretation of the myriad of 12 lead ECG anomalies and conditions is beyond the scope of an entry-level course focused on cardiac rehabilitation. However, there are a few very common 12 lead ECG conditions that the exercise science professional will no doubt come across when they work in the field of cardiac rehab. Therefore, this chapter will focus on the common and very important ECG anomalies.
Myocardial Ischemia
In a normal healthy human heart blood supply to the myocardium is plentiful. Indeed, even at peak exercise intensity, the heart is still getting the required oxygen, and work limitations become the rate of oxygen delivery to the exercising tissues and the overall strength of the heart (cardiac output). Atherosclerosis and the resulting coronary occlusions that occur begin to reduce blood supply to the myocardium. At rest the patient may not notice this reduction since their myocardial oxygen demand is low.
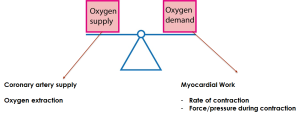
As the demand for oxygen increases within the myocardial tissue, the distribution of flow to the heart sees limitations typically within the sub endocardium first. This is due to the limited perfusion of the tissue from limited supply. It is a bit like dropping a bit of water on a dry sponge; the top layers get saturated, but lowest layers are still dry.
This subendocardial ischemia creates limitations on oxidative metabolism, leading to anaerobic metabolism and lactic acid formation. The reduced pH causes changes to the ECG, specifically to the ST segment. The ST segment drops below the isoelectric line and is referred to as ST segment depression.
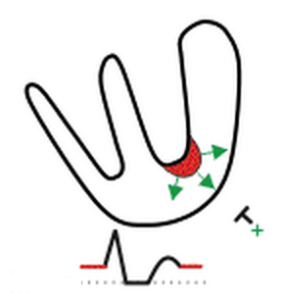
ST segment depression is assessed both by morphology (shape) as well as the amount (in mm) for depression. Here is an example:
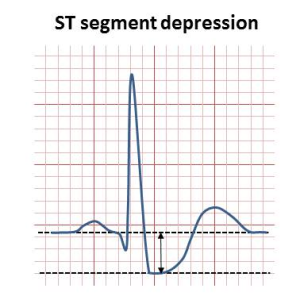
The exercise science professional needs to monitor the ECG during exercise with cardiac patients and be able to recognize ST depression. Patients need to avoid ischemic during exercise, so if ST depression is seen, a blood pressure and heart rate is taken to determine myocardial oxygen demand (rate pressure product) and then work is reduced.
Other conditions where you might see ST depression.
There are other conditions that are non-ischemic in nature, but also display ST segment depression. These include:
- Left ventricular hypertrophy
- Left bundle branch block
- Right bundle branch block
- Effects of digoxin (heart medication)
- Reciprocal, mirror like effects (in opposite leads) of ST elevation in acute MI
Due to the various causes of ST segment depression, it is important to have a complete patient history as well as a resting ECG to rule out some of the other causes of ST depression before proceeding with the conclusion that myocardial ischemia is the cause.
Myocardial Infarction: “MI”
A myocardial infarction occurs when blood flow through a coronary artery is completely blocked, often due to a blood clot or ruptured plaque. Downstream flow from the occlusion is stopped, and depending on the size of the area affected, can lead to sudden death. Within one hour the cells affected by the lack of flow will die, so reperfusion is essential.
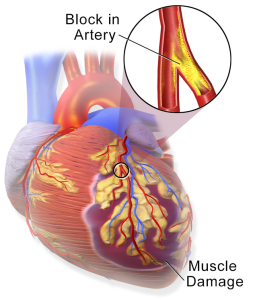
ECG Indicator of the MI
Determining whether an MI is occurring is done both with ECG evidence as well as blood markers that indicate cardiac cell death. For the ECG, we can see dramatic changes to the ECG. During an acute MI the ST segment is elevated and seen in leads corresponding to the affected area of the heart. In the opposing leads ST segment depression is seen. Myocardial infarctions that show this ST segment elevation are referred to as STEMIs (“ST segment Elevation Myocardial Infarction). Since the ECG change does not always occur, one can see non-STEMI infarcts as well. This ST elevation is only seen in the acute phase of the MI. Overtime, the ST segment begins to return to baseline, while at the same time a large Q wave begins to appear. The Q wave becomes the “scar” left over as evidence of the past MI.

Blood Markers for MI
Within the blood, one can measure enzymes and proteins that normally would be inside the cardiac cells. However, if they appear in the blood, that indicates cardiac cell death.
Troponin I– This protein is part of the sarcomere and integral to cell contraction. The Troponin type “I” is specific to cardiac muscle, so if seen in the blood is a positive indicator for an infarction.
Creatine Kinase MB (CK-MB)- Creatine kinase is an enzyme within the sarcomere that helps liberate the phosphate energy from phosphocreatine. There are different isoenzymes of “CK” and when run through gel electrophoresis, the myocardial band (MB) can be easily identified. The presence of CK-MB in the blood therefore indicates cardiac sarcomere damage and confirms the infarction.
Other conditions where you might see ST segment elevation
- Coronary vasospasms
- Pericarditis
- Ventricular aneurism
- Left bundle branch block
Can you identify the location of the STEMI?
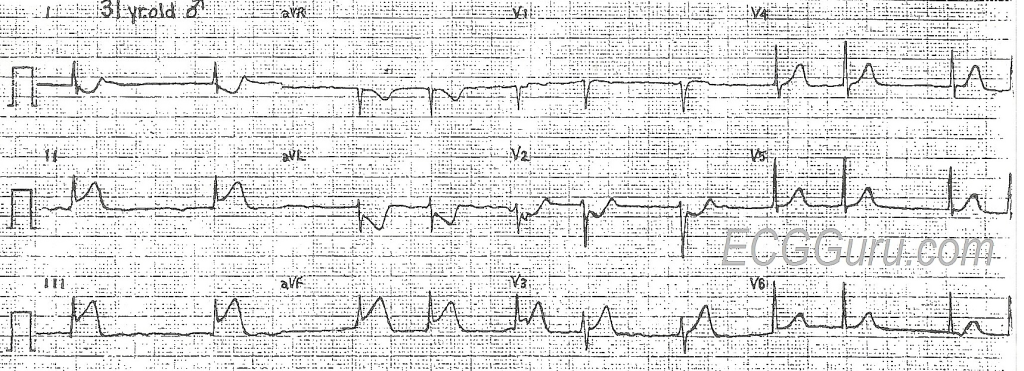
The exercise science professional may only see the acute STEMI ECG by reading patient case histories, but it is still important to assess the starting ECG, identify any significant Q waves due to the past MI and recognize ST elevation so that prompt action can be taken in the event of its occurrence.
Conduction Defects in the Bundle Branches
Left and Right Bundle Branch Blocks
A previous chapter discussed the rhythm disturbances that occur when there is a delay of block in conduction at the AV node. These delays can cause significant changes in the ventricular rate, leading to a loss in cardiac output. If we move beyond the AV node, and move further into the ventricle, we encounter the bundle branches. The left bundle branch is the first path for the electrical signal from the AV node, which causes depolarization of the left ventricle. Then it separates to include a right bundle branch, depolarizing the right ventricle. The bundle branches further divide into smaller fascicles and finally the Purkinje fibers, creating an extensive network of fast conducting fibers, resulting in an almost simultaneous ventricle contraction in both ventricles.
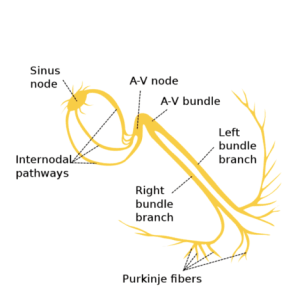
Delays in the conduction of signals through the bundle branch will affect the QRS complex and delay the ventricular depolarization cycle. Delays may only affect the right bundle branch or may affect the left. Affecting the left bundle branch shows a more dramatic alteration in the ECG, since the left bundle is the initial bundle coming from the AV node. Let’s examine the 12 lead ECG for both the right and left bundle branch blocks.
Right Bundle Branch Block
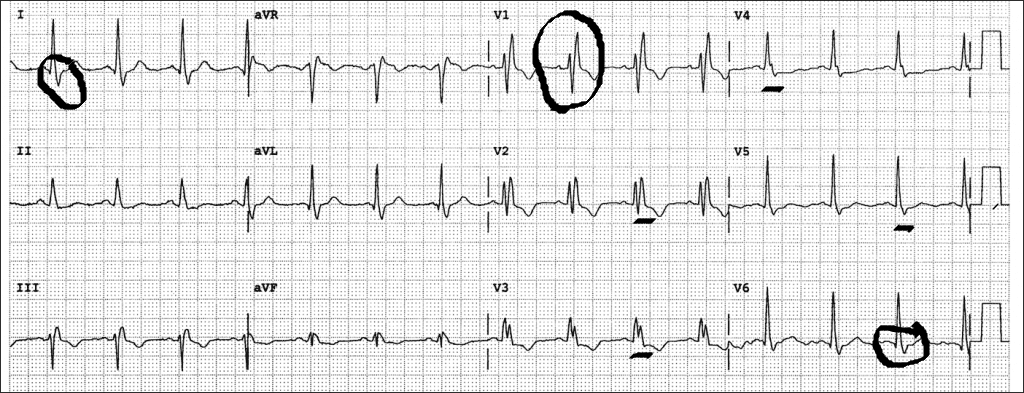
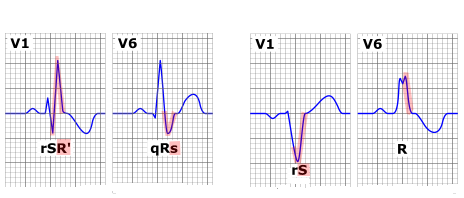
Most of the QRS complex that we see is from the depolarization of the left ventricle, with the right bundle and ventricle presences seen in the latter portion of the QRS. For that reason, delays in conduction through the right bundle branch will cause delays in the QRS on the “back” portion of the QRS. In certain leads this means that the S wave will show a widened appearance (key leads are Lead I and V6, and in other leads (key lead is V1) a second R wave will be seen.
Key Indicators of a Right Bundle Branch Block
- Wide QRS complex (>0.12s)
- Lead 1, V6 wide S wave
- RSR’ in lead V1 (second r wave seen)
Causes and Clinical Significance
The right bundle branch block is considered a benign (non-significant) clinical condition. No medical treatments are given. Causes include:
- Normal aging of the conduction system (idiopathic)
- Congenital condition with no clinical indication
- Myocardial infarction (develops post MI)
- Hypertension
- Lesions or scar tissue from myopathy or infarct
Left Bundle Branch Block
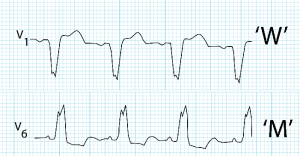
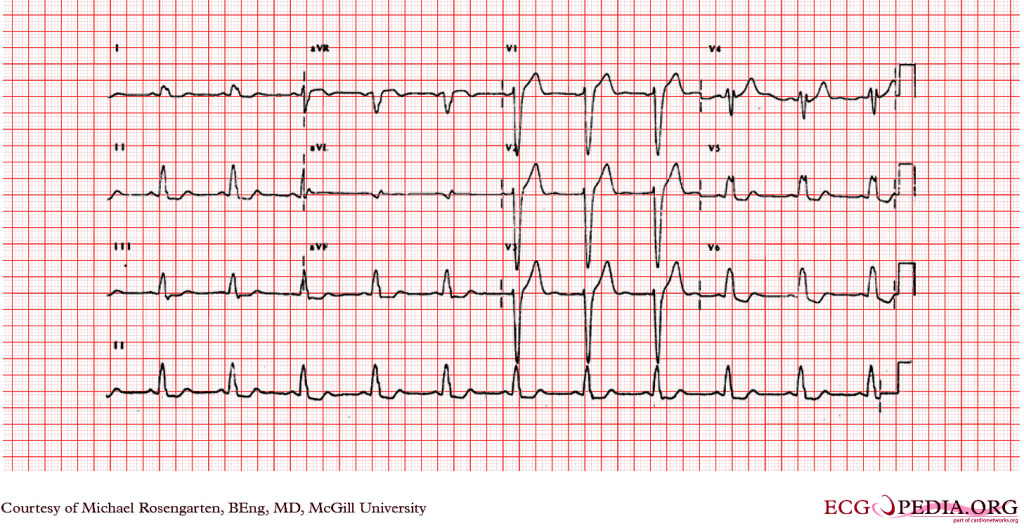
Unlike the right bundle branch block, the left bundle branch block (LBBB) is related to some type of underlying clinical pathology or condition. The left bundle branch is supplied blood by the left anterior descending coronary artery, so an MI or occlusion of the LAD may link directly to the LBBB. From a depolarization perspective, a LBBB causes a reversal of the sequence of depolarization. Normally the ventricle depolarizes from left to right. However, with a blocked left bundle branch, the signal must travel first to the right ventricle and then slowly travel across to the left ventricle. When this occurs, once can see a separation of the two ventricles depolarizing, and “notched” waves are see the conduction delays are significant, and the QRS complex is wide (>0.12s).
Key Indicators of Left Bundle Branch Block
- Wide QRS (> 0.12s)
- Notched QRS (“M” shape or “W” shape) seen in multiple leads
- ST segment depression and T wave inversion (“strain pattern”)
- QS wave in V1 or RS seen
Causes and Clinical Significance
LBBB is clinically significant and related to some type of pathology. These can include:
- Coronary Artery disease (especially LAD)
- Myocardial infarction
- Cardiomyopathy
- Hypertension
- Congestive heart failure
- Left Ventricular Hypertrophy
Left Ventricular Hypertrophy
The left ventricle is responsible for ejecting blood into systemic circulation and is larger than the right ventricle. Ventricular hypertrophy can be a natural conditioning effect, as seen in aerobic athletes. In this case the ventricular chamber size increases, the muscle becomes proportionally stronger, and the chamber maintains an ideal shape for blood ejection. However, with clinical populations, left ventricular hypertrophy is a result of some type of chronic condition that causes a pressure overload stress on the ventricle, impairing ejection. As a result, there are physical changes to the ventricle that reduce its pumping effectiveness (reduced ejection fraction).
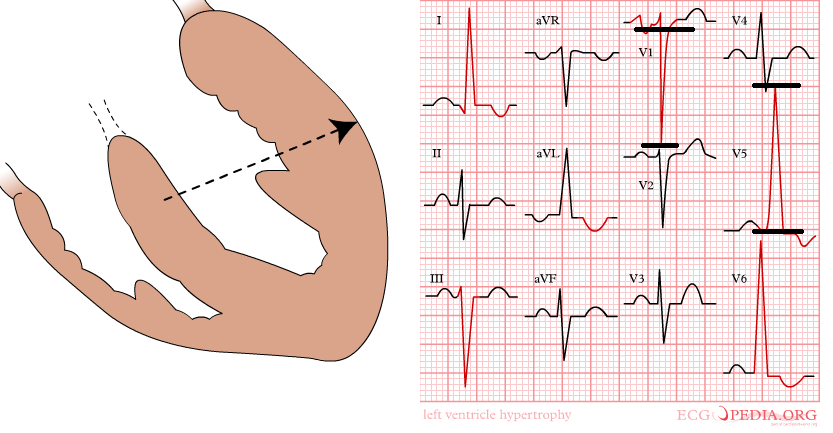
Most commonly, the pressure stress is related to chronic hypertension, so it is not surprising that left ventricular hypertrophy is a relatively common condition. Identifying LVH on the ECG is an important part of understanding the patient’s condition. The most dramatic changes to the ventricle seen in LVH is a thickening of the left ventricle along with a dilation of the chamber that alters its shape and reduces contraction strength. On the ECG the added thickness of the myocardium can be seen by a lengthening of the ventricular depolarization (wide QRS) along with an increased voltage magnitude (large QRS complexes). Repolarization of the ventricle is also affected, and often a combination of ST segment depression along with T wave inversion is seen. This unique repolarization change is known as Left Ventricular Strain, and can also be seen in other heart conditions (LBBB).
Key Indicators of Left Ventricular Hypertrophy
- S wave in V1, plus the R wave in V5 or V6 (whichever is larger). Total > 35mm
- Left Ventricular Strain Pattern (ST segment depression, T wave inversion
- Wide QRS (>0.10)
- Left axis deviation (greater than -30 degrees)
Note, the ECG may not show all of these indicators, but most often voltage increases and LV strain.
Causes and Clinical Significance
Left ventricular hypertrophy is common in patients with a range of clinical conditions. Causes and conditions include:
- Hypertension
- Myocardial infarction
- Aortic stenosis
- Cardiomyopathy
- Coronary Artery Disease
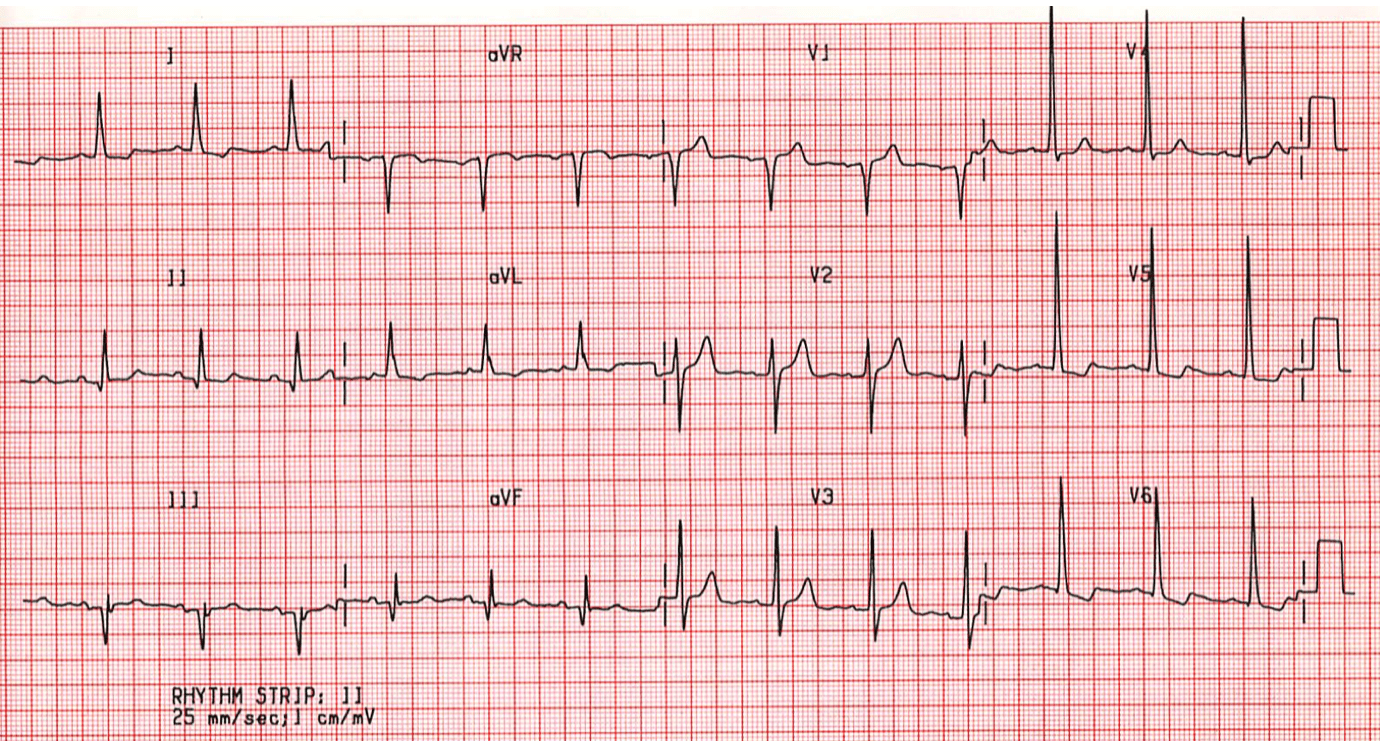
The exercise science professional should be able to identify LVH as part of the overall case history of the patient. Linking what is seen on the ECG with the clinical condition of the patient helps create a comprehensive understanding of their condition, a first step to designing exercise plans.
Selected Sources
https://litfl.com/ecg-library/
Clinical Exercise Electrocardiography Levine S, Coyne B, Colvin L,. Jones & Bartlett Pub. 2015.
Marriott’s Practical Electrocardiography. 13th ed. Straussn D, and Schocken D. Wolters Kluwer Pub. 2021
EKG/ECG Interpretation. Mastenbjork M, Meloni S., Andersson D. Medical Creations Pub. 2016
The middle and thickest layer (between endocardium and epicardium) of the heart muscle.
A chronic, inflammatory disease characterized by a buildup of cholesterol-laden plaque on the interior of the arteries, ultimately reducing blood flow to vital organs.
The innermost layer of tissue, lining the inner chambers of the heart muscle. It also contains the Purkinje fibers and conducts electrical signals to the myocardium. During ischemia, this tissue is often the first to experience a reduction in blood and oxygen.
The baseline or zero line on the electrocardiogram where there is no electrical activity present. This is the line between the end of the T wave and the beginning of the P wave, and the PR segment. Measures of ECG wave magnitude is made from the isoelectric line (i.e. voltage, ST segment depression)
Often called a “heart attack” is when a coronary artery is blocked and blood flow to a portion of the heart is stopped, leading to cell death.
Refers to the complete blockage of a blood vessel or other tubular structure. Sometimes coronary artery degree of blockage is referred to as a percent occlusion. Sometimes used synonymously with the term “Stenosis.”
Contractile protein. “I” form located in the heart. When it is found in the blood it is a marker for an acute myocardial infarction
Creatine Kinase-Myocardial Band is an enzyme within heart tissue. During a myocardial infarction, damaged cardiac tissue releases CK-MB into the blood, where it can be measured as evidence of an acute myocardial infarction. It is used as a blood marker of MI.
An abnormal bulge or ballooning in the wall of a blood vessel. An aneurysm can burst. This is called a rupture. A ruptured aneurysm causes bleeding inside the body and often leads to death.
A disease or condition that arises spontaneously and from an unknown cause. This often makes treatment difficult since the cause of the condition is unknown.
A pattern seen on the ECG, particularly the QRS and T wave complex. Typically, it is a combination of ST segment depression and T wave inversion. Left ventricular strain patterns are often seen in left ventricular hypertrophy, left bundle branch block and cardiomyopathy.
