1 Focused Anatomy and Physiology Review
It is assumed that you are utilizing this text for the specific purpose of understanding how to work with the cardiac patient in the phase I, II or III environment. You have already taken and passed basic human anatomy and physiology, and probably also an exercise physiology class. However, the firehose of information that is your typical anatomy and physiology class means that you may have lost a few memories of cardiovascular anatomy and physiology that are pertinent to the study of cardiac rehabilitation. Therefore, the intent of the chapter is to refine your focus to the areas of anatomy and physiology most utilized in this text. There are also common terms and concepts to begin your acquisition of the clinical language of the field. If you want more in-depth review material for your anatomy and physiology, here is an open source A&P source link:. (Note: if you are using a hand copy text, see list of links to videos at the end of the chapter).
Major Components of the Cardiovascular system
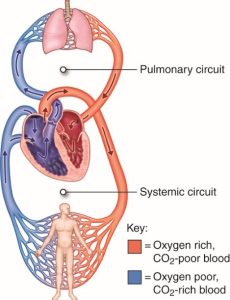
The purpose of the cardiovascular system is to serve as a system to both deliver oxygen and nutrients to organs and tissue beds and to also remove waste products for removal by the lungs and kidneys. It is a closed loop system and is pressurized. The heart is the central pump that drives the vascular system. One might say you have 2 hearts: one that collects blood from the deoxygenated venous side of the system and pumps the blood to the lungs for oxygenation (the right side of the heart), and the left side, which receives the recently oxygenated blood from the lungs and pumps it to the rest of the system (“systemic circulation”). For much of the discussion about the function of the heart, heart disease, strength of the heart and assessment of heart disease, it is this left side of the heart that is most often the area of focus.
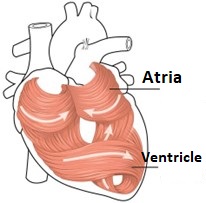
The Heart as a Pump
There are 4 chambers of the heart, each formed to hold and pump blood. The atrial musculature is wrapped to form a hollow chamber. The left and right atria are designed to collect blood, and then to contract and send the blood to the left and right ventricle. Notice how the fibers of the ventricles are wrapped to form their chambers (Figure 1)? This serves as a mechanism to create a squeezing pressure when the ventricles are stimulated to contract. The ventricles form a shape that helps direct flow into the pulmonary artery towards the lungs for the right side and out the aorta for the left side.
External Heart Anatomy
Since the heart is a muscle, it also needs both an arterial and venous system in order to function. These blood vessels lay inside grooves or sulci on the exterior of the heart.
Go to this website for a quick review of key coronary arteries
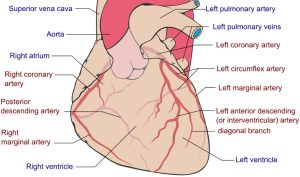
Heart muscle is an aerobic muscle. The oxygen demands of the myocardium is such that up to 80% of the oxygen available in the coronary arteries is extracted at rest. So, the heart can’t rely much on greater oxygen extraction per unit flow, but instead must rely on increased coronary flow to obtain the oxygen it needs during heavy exercise. This is why coronary blood flow limitations create reductions in oxygen availability to the myocardium, thereby reducing heart pump action.
Internal Heart Anatomy
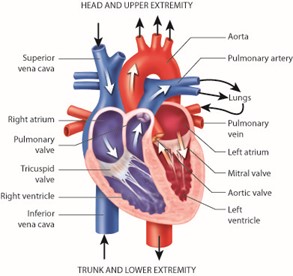
In order that this closed loop system to maintain a one directional flow, the atria and ventricles have valves that can open and close, to allow entry and exit of blood without blood moving in the wrong direction. Between the atria and the ventricles, we have the “A-V” valves. The tricuspid valve, with 3 leaflets will open to allow blood into the right ventricle, while the 2-leaflet bicuspid or Mitral valve allows blood into the left ventricle. In some clinical conditions, valves do not close completely (valve stenosis) or the valves bulge into the atria (prolapse). In these cases, blood will “regurgitate” backwards into the atria during ventricular systole. This type of clinical condition can lead to heart arrhythmias and heart failure. Identifying valve conditions will be discussed in later chapters. For now, go to this site for a brief video of mitral valve regurgitation.
The Cardiac Cycle
Go to this site for a brief video animation of the cardiac cycle
When the ventricles begin to contract and create pressure, the tricuspid and mitral valves are forced shut, making a sound that can be heard with a stethoscope. Note how the valves are secured in place with the chordae tendinea and papillary muscles. Working together, they keep the A-V valves from bulging into the atria due to the high pressure in the ventricles and ensure that blood will not travel backwards. When the ventricles have created enough pressure to open the pulmonic and aortic valves blood is squeezed out of the ventricle in one large pressure wave. This is referred to as the systolic phase or systole (figures 5 & 6).
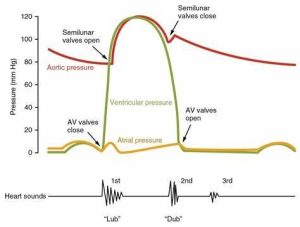
When the ventricles begin to relax (diastole), pressure inside drops, which creates a brief reversal of some of the blood that was ejected into circulation. When this backward flow of blood hits the aortic and pulmonic valves, they are forced closed, creating a second heart sound. At the same time the low pressure in the ventricle also allows the blood collected in the atria to flow down to the ventricle in preparation for the next systolic contraction.
Important note on circulation of blood to the myocardium.
It may seem like the heart is doing all the work pushing blood away from itself. So, when does the heart muscle get its own blood supply? When the ventricles are contracting during systole the coronary arteries are squeezed in their sulci (the small groves on the heart surface where the arteries reside), so they get very little oxygen. However, during diastole they are wide open. Remember that backward flowing pressure wave that closes the aortic valve? Well that same pressure wave also pushes blood into the coronary arteries, which opens just in front of the aortic valve. So coronary arteries get their blood supply during the diastolic phase of the cardiac cycle. (go to this site for a video overview of coronary blood flow during diastole)
A system under pressure!
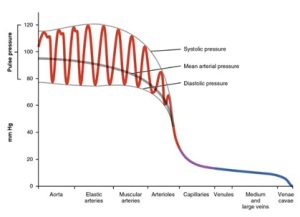
As you look at the pressure figure above, note that the arterial side of the vascular system is under higher pressure than the venous side. Each ventricular contraction sends a bolus of blood through the arterial system, generating a (systolic) pressure wave. Between beats, you see that pressure drops to a lower level, but the system is still pressurized much higher than the venous system. This arterial pressurization ensures that oxygen rich blood is pushed into systemic arteries, arterioles and capillaries. Systolic blood pressure (SBP) is the pressure in the arteries during ventricular contraction and is measured in millimeters of mercury (mmHg). Diastolic blood pressure (DBP) is the pressure in the arterial system between the ventricular contractions (Figure 6).
Other pressure measurements can be derived from the systolic and diastolic pressures to provide additional information. Pulse pressure (PP) is the difference in pressure between systolic and diastolic (so PP= SBP-DBP ). So a blood pressure of 120/80 would give us a pulse pressure of 40 (120-80).
Mean arterial pressure (MAP) represents an average pressure (rather than the large swings in SBP and DBP). An indirect measure of mean pressure can be obtained by adding diastolic pressure to one third of the pulse pressure: MAP= DBP + 1/3(PP). So a blood pressure of 120/80 gives us a MAP of 93.2 (40 + 13.2).
When blood enters the arterioles and capillaries there is a substantial drop in pressure as well as a loss of the pulsatile nature of the flow. Venous blood flow becomes non pulsatile and quite low pressure, with pressure dropping to near zero in the vena cava. Since the cardiovascular system is a closed-loop system, the blood cannot really go anywhere, but the lack of pressure on the venous side means that the veins can hold larger volumes of blood, like a slow moving river that widens and holds more water. Therefore, blood returning to the heart (also known as Venous Return) can be influenced by several factors:
Venous capacitance– Veins can act as reservoirs of blood by changing their diameter, much like a flood plain accommodates a larger volume of river flow. Veins can constrict under sympathetic system influence and hold less blood and return more to the heart.
Posture and the influence of gravity. Imagine standing for long periods of time. Your entire vascular system is almost like a tube of fluid, and there are higher fluid forces (hydrostatic pressure) pushing downward, meaning that the lower limb veins will hold more fluid and cause a reduced venous return. This can be especially evident after heavy exercise when blood vessels are quite dilated.
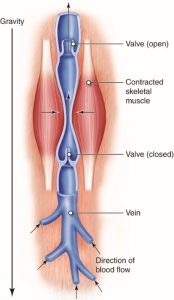
Skeletal Muscle Pump. One way to enhance venous return is a bit like squeezing toothpaste out of a tube. During exercise or especially during a cooldown, veins passing between contracting skeletal muscles are “milked” such that the squeezing of the vessel pushes blood through the one-way venous valves and back to the heart. For enhancing venous return following exercise, this is why an active cool down is essential to ensure adequate venous return and reduce chances of venous pooling and a drop in mean pressure (Figure 7).
Respiratory Pump. Another way of drawing more blood back to the heart is to take advantage of the changes in intrathoracic pressures seen during breathing. During inhalation, intrathoracic pressure drops, drawing air into the lungs. However, this drop in pressure will also draw more venous flow from the lower extremities. Work with your clients to ensure they are adequately breathing, to both enhance oxygenation of their blood and assist venous return.
Work of the heart
You might be sitting in a chair relaxing right now. Your skeletal muscles are doing very little work, and your systemic need for oxygen to help provide ATP for these muscles is minimal. But the heart is always working! In fact, you might be sitting still, but if you are stressed, you may have elevated blood pressure and heart rate, making much more work for the heart. Its need for oxygen is constant. Typically, coronary blood flow is such that the demand for oxygen is easily met by the flow of blood. However, as we will see with heart disease patients, coronary blood flow can be severely restricted.
So, what kind of “work” is the heart doing and how do we measure it?
We are most concerned with the work of the left ventricle, since that is the chamber pushing blood into systemic circulation. Understanding the volume of blood ejected, the percentage of available blood ejected, the rate at which these ejections take place and the pressure generated during contraction will give us a sense of the work of the heart.
A few terms first:
End-Diastolic Volume– This is the volume in the ventricle at the peak of filling, at the end of the diastolic phase.
End-Systolic Volume– This is volume remaining in the ventricle at the end of the systolic phase. Even in strong hearts, there is still blood remaining.
Stroke Volume– This is the volume of blood that is ejected from the ventricle with each contraction. This volume can vary based on heart size, age, conditioning and disease factors.
Cardiac Output– This is the total volume of blood moved through the system each minute. It is calculated by multiplying the volume ejected each beat (Stroke volume) by the number of beats per minute (heart rate): so Q= SV x HR
Ejection Fraction– This is the percentage of the end-diastolic volume that is ejected each contraction. It is computed by dividing stroke volume by end-diastolic volume and multiplying by 100: EF= (SV/EDV)*100. Normal ejection fraction is 60% at rest. It may rise to 65-70% during exercise, as the ventricle contracts more forcefully. EF is our best measure of cardiac contractile performance.
a-VO2 Difference– This is the difference in oxygen content of the blood in the arteries versus the veins, and represents oxygen extracted by the tissue bed. This “arterio-venous oxygen difference” is tied to work done by the body; as work increases so does the a-VO2 difference. Oxygen content of the arteries is based on the level of hemoglobin and an assumed carrying capacity of 1.34ml O2 per mg/dl hemoglobin.
Aerobic fitness limitations in healthy individuals vs cardiac patients
Peak aerobic fitness is typically best described using the Fick equation, which basically says that one’s ability to perform physical work is linked to the maximal amount of oxygen that can be utilized per minute to produce ATP. VO2max, is this maximal oxygen uptake measure. VO2 is linked to the ability to move oxygenated blood as fast as possible (Cardiac Output) together with the ability to extract as much oxygen from the blood stream as possible (a-VO2 difference).
Fick Equation and Fitness in Healthy Individuals
VO2= Q x a-VO2 difference
Since cardiac output (Q) is Heart Rate x stroke volume, a larger stroke volume and higher heart rate will mean greater Q. With more blood vessels in the muscles and mitochondria to extract oxygen, the greater the a-VO2 difference possible.
In a healthy individual, fitness will require training the heart, metabolic and vascular system to adapt and improve the ability to move blood and extract oxygen.
Atherosclerosis and a reduced oxygen delivery in heart disease
In atherosclerosis there are reductions in coronary blood flow due to narrowing (occlusions) within the arteries. Since the oxygen the myocardium requires during work comes from increased coronary flow, and reductions in flow will mean that the heart muscle is limited in the work it can do.
When does coronary flow occlusion become significant?
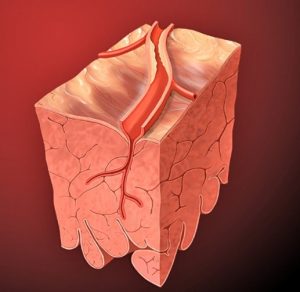
Arteries are pretty resilient. They can increase lumen size to expand as plaques build up, but flow will begin to drop at around 70% occlusion. This causes significant reductions to the amount of oxygen that can be delivered to the myocardium. Wherever the occlusion is located, flow downstream and the local myocardial muscle will be affected. The first part of the myocardium affected will be the endocardium, since it is furthest from the coronary artery.
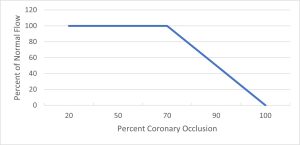
When a coronary artery exceeds 70% occlusion, flow is restricted through the artery, leading to reduced oxygen delivery to the myocardium. This will result in myocardial ischemia, or a reduction in oxygen delivery to the myocardium. Contractile performance of the myocardium will also be compromised (Figure 9).
Supply demand imbalance: fitness limitations in cardiac patients
One might think of physical activity and work in two ways. One is the whole-body work of movement, explained by the Fick equation (VO2= Q x a-VO2 diff). The other is the work of the heart itself. In the healthy individual limitations in work are related to the rate of oxygen use, but in the heart disease patient it is the oxygen delivery to the heart that is the limiting point.
Myocardial Oxygen use- Work of the heart
The heart muscle utilizes oxygen to contract repeatedly. While we can’t directly measure the myocardial oxygen use, we do have some measures that can be performed in the clinical setting that indicate work of the heart.:
Heart rate– measurement of the ventricular rate provides one measure of the work of the heart
Systolic Blood pressure– The contractile strength of the heart influences oxygen use, and systolic blood pressure is a good indicator of force being generated with each ventricular contraction.
Therefore, a good analog of work of the heart is the combination of these two measures. This is a measurement known as Rate Pressure Product:
Rate Pressure Product (RPP)= Heart rate x Systolic blood pressure
In future chapters you will see how RPP can be used to help prescribe appropriate exercise for the cardiac patient, so that they stay within the oxygen supply limits of their coronary arteries.
Electrical Pacing of the Heart
“The SA node is the pacemaker of the heart”. I’m guessing you have heard that from past anatomy and physiology classes. Well, it is true, but of course you may also know that ANY cardiac cell could be a pacemaker for the heart. That is because cardiac cells have what is called automaticity. That is, each cell can beat on its own without any external stimulus. Skeletal muscle is not like this. It needs a signal from the brain to contract.
So how can a cardiac cell beat on its own? The secret is: leaky cells. If we look at a cardiac cell at rest, it has a negative membrane potential. For the cell to depolarize, that membrane potential must be brought to its threshold before sodium gates open to initial depolarization. However, Sodium leaks inward from the extracellular space, slowly causing the membrane potential to rise, and eventually the cell reaches its threshold and depolarizes (Figure 10). If this cell is the first to reach depolarization, then the depolarization wave will spread to the other cardiac cells.
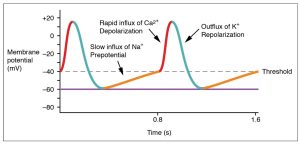
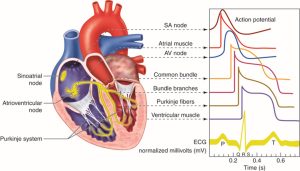
So why is the SA most often the pacemaker? Because it has the leakiest cells, and therefore they reach depolarization faster than other cells. Without any nervous system controls, the SA node cells fire at about 90 beats per minute (figure 11).
What about other cells, can they become a pacemaker? Yes! While they have differing rates of contraction, other cells can become pacemakers, and this is seen in some cardiac rhythm disturbances that you will learn about later. For example, if the AV node (junction) were the pacemaker, the heart would beat at about 50 beats per minute, the ventricle pace might be 30 beats per minute (yikes!) if the ventricular cells became the pacemaker.
Selected References
Open Learning Initiative- Carnegie Mellon https://oli.cmu.edu/courses/anatomy-physiology-i-ii-v2-academic/
Anatomy and Physiology- CCCOnline https://pressbooks.ccconline.org/bio106/
Anatomy and Physiology- OpenStax. https://openstax.org/details/books/anatomy-and-physiology
Links to videos within Chapter 1
Anatomy and Physiology Resource: https://oli.cmu.edu/courses/anatomy-physiology-i-ii-v2-academic/
Coronary Artery Anatomy: https://youtu.be/xuIFY3onWPQ
Mitral Valve Regurgitation Video: https://youtu.be/xuIFY3onWPQ
Animation of the Cardiac Cycle: https://youtu.be/JE_LWlnaRdY
Coronary blood supply during diastole: https://youtu.be/SNdGSkrQ0gQ
Circulation of blood from the heart, through arteries, arterioles, and capillaries, delivering nutrients to the cells. It is also deoxygenated blood in the venules, veins, and blood circulating back to the right atrium.
This refers to grooves or furrows. These are found on the surface of the heart and are where the coronary arteries sit. Sulci are compressed during ventricular systole but relaxed during diastole. This is how the ventricle can get its own coronary blood supply during the diastolic phase.
The middle and thickest layer (between endocardium and epicardium) of the heart muscle.
The abnormal backflow of a fluid. With respect to a heart valve, blood typically flows in one direction through an open valve and then when the valve closes, flow cannot go back. However impaired valves can create openings allowing for blood to flow backwards. Mitral valve prolapse is a condition where regurgitation occurs.
The contractile phase of the cardiac cycle. The pressure generated during this phase is the systolic blood pressure.
The relaxation phase of the heart where there is no ventricular contraction. The pressure within the arterial system during the diastolic phase is known as Diastolic Pressure.
A value that represents the average pressure in the arteries during a single cardiac cycle. It is calculated as: Diastolic pressure + 1/3 pulse pressure. A blood pressure of 120/80 is a MAP of 93. Below 60-70mmHg MAP cerebral perfusion may be inadequate and the patient may lose consciousness.
Refers to the blood returning to the heart (right atrium) from the venous circulation. Venous return can be influenced by posture, the skeletal muscle pump, and the respiratory pump.
The ability of the veins to expand and contract and serve as a reservoir of blood and help maintain venous pressure and cardiac output.
Contraction of muscle, primarily in the legs, that squeezes veins, causing increased venous return. This is especially important post exercise to prevent sudden drops in blood pressure due to venous blood pooling.
The volume in the ventricle at the end of diastole. It is influenced by venous return, preload and heart rate. At high heart rates, EDV is reduced due to shorter filling times. This is especially important in cases of accelerated heart rhythms such as SVT and ventricular tachycardia.
The volume in the ventricle at the end of systole. It is influenced by both preload and afterload as well as the strength of heart contraction.
The volume of blood ejected from the left ventricle with each contraction.
The percentage of blood ejected from the left ventricle relative to the end diastolic volume. It is a key measure of heart contraction strength. EF= (stroke volume/ EDV) x 100
The difference in oxygen content between the arterial side and the venous side. It is representative of the oxygen extracted by the tissue. Influenced by blood flow to a tissue bed, density of capillaries and the size and number of mitochondria.
The innermost lining of cardiac tissue in the heart
An index of myocardial oxygen use (“work of the heart”). RPP is calculated as heart rate x systolic blood pressure.
The intrinsic ability of a cell (such as a cardiac cell) to generate electrical impulses and contract rhythmically without external stimulation. Different cells of the heart have different firing rates, with the SA node having the fastest.
